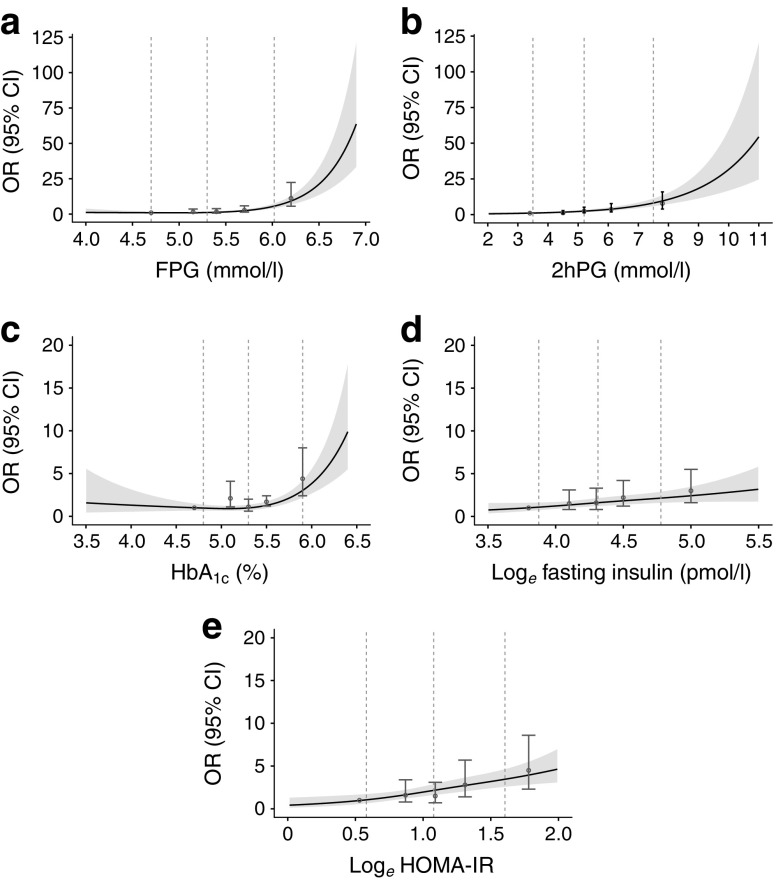
Fig. 1.
Curves of ORs (95% CI) derived from logistic regression models including restricted cubic splines to evaluate the associations of incident type 2 diabetes with (a) FPG (b) 2hPG (c) HbA1c (d) loge fasting insulin and (e) loge HOMA-IR. The dots (95% CI) are the ORs after each risk factor is converted into quintiles with the first dot indicating the lowest quintile, which is used as reference category. Adjustment was made for age, sex, and follow-up duration. The vertical dotted lines indicate the knot locations (percentile 10, 50, 90)

