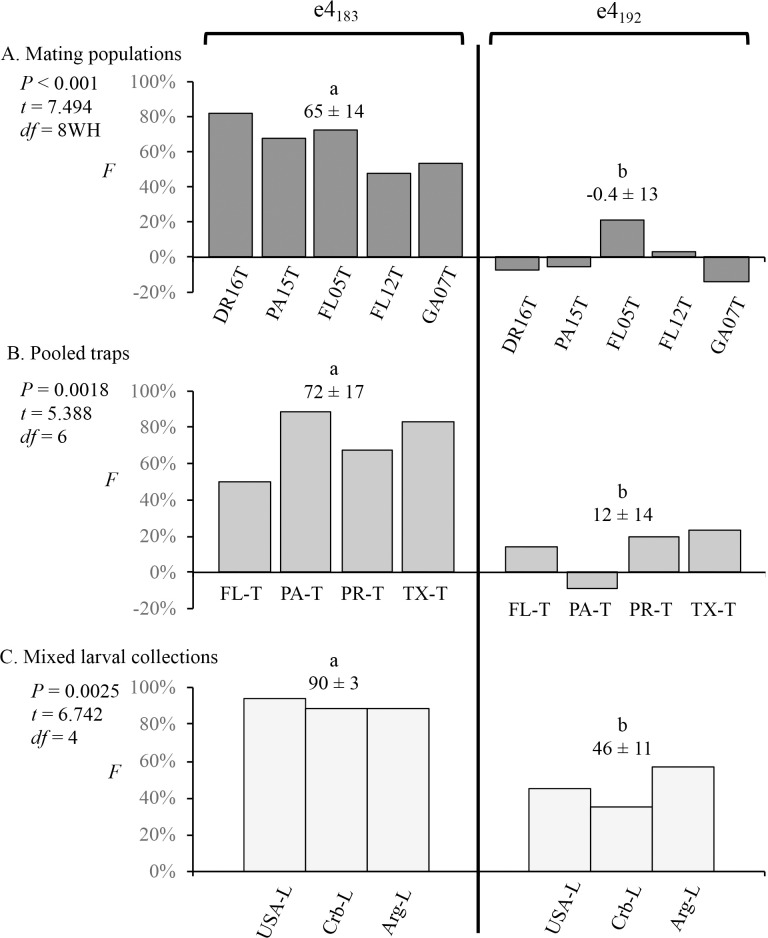
Fig 5. Comparisons of inbreeding coefficients (F) for the e4183 and e4192 SNPs calculated for different mating populations and collection methods.
The mean F ± SD is listed for each category. Pairwise comparisons between the means were calculated using single-tailed t-test with significant differences indicated by different lower-case letters. (A) Inbreeding coefficients calculated for pheromone trap collections from a single time and location and therefore are representative of a single breeding population. (B) Inbreeding coefficients calculated for pooled pheromone trap collections from different times or locations within a state. (C) Inbreeding coefficients calculated for pooled larval collections from a given country or region.

