Fig. 2.
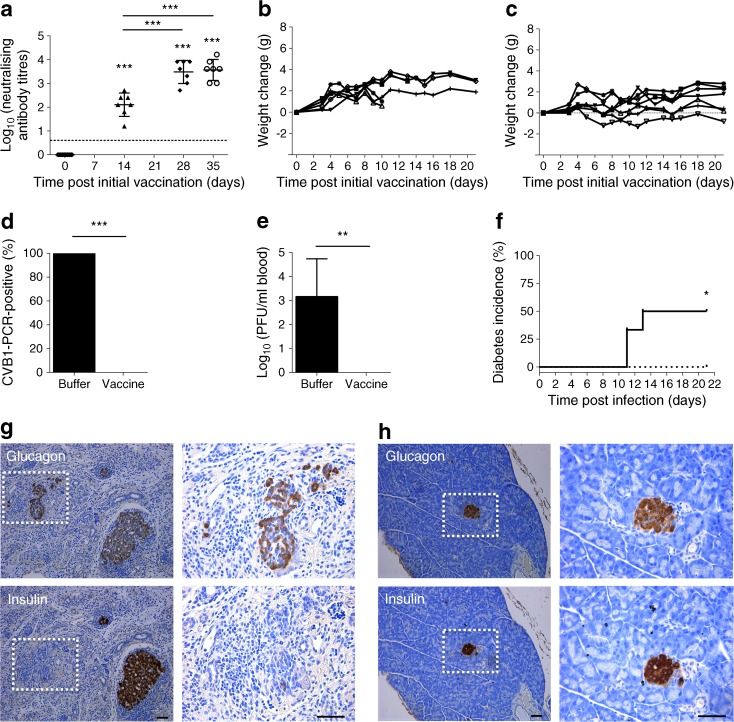
SOCS1-tg mice are protected from virus-induced diabetes by the CVB1 vaccine. (a) Neutralising antibody titres in the serum of vaccinated mice (n = 7) sampled prior to vaccination on days 0, 14 and 28 and before infection on day 35. The dotted line illustrates the neutralising capacity threshold in the virus neutralisation assay. Each serum sample was analysed in two independent neutralisation assays and the mean neutralising antibody titre calculated. Mean values are indicated by the line ± SD; ***p < 0.001 compared with day 0 or indicated time point as determined by one-way ANOVA. (b, c) Weight changes of individual mice treated with vaccine buffer (n = 6) (b), or CVB1 vaccine (n = 7) (c) after infection with 106 PFU CVB1. Each individual animal is represented by a single line. Three of the buffer-treated animals developed diabetes and were removed prior to day 21. (d) Percentage of buffer-treated (n = 6) or vaccinated mice (n = 7) positive for CVB1 in the blood on day 3 p.i. as detected by RT-PCR. ***p < 0.001, χ 2 test. (e) Cytopathic virus measured in the blood of buffer-treated (n = 6) or vaccinated (n = 7) mice on day 3 p.i. by standard plaque assay. Mean values ± SD; **p < 0.01, Mann–Whitney U test. (f) Cumulative diabetes incidence in buffer-treated (black line) and vaccinated (dotted line) SOCS1-tg mice after infection with CVB1, p < 0.05 comparing the two groups as determined by logrank Mantel–Cox test. Formalin-fixed, paraffin embedded SOCS1-tg mice pancreas sections stained with insulin or glucagon antibodies by immunohistochemistry. Shown are representative images from (g) buffer-treated and (h) CVB1-vaccinated mice. Images on the left of each panel are at ×16 magnification and the white box indicates the area of magnification shown in the right panels (at ×40 magnification). Scale bars, 50 μm. (g) Note the loss of acinar tissue and immune cell infiltration in tissue from buffer-treated animals

