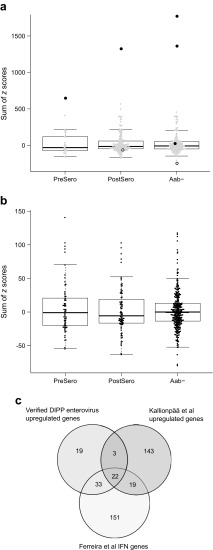
Fig. 3.
Expression of the 77 genes present in our enterovirus-induced signature and upregulated in all three in vitro enterovirus infections in microarray data published by: (a) Kallionpää et al [15]; and (b) Ferreira et al [27]. Sums of child-specific z scores over the 77 genes were calculated for each of the 356 whole blood samples by Kallionpää et al [15] (GEO: GSE30211) and the 454 PBMC samples by Ferreira et al [27] (Array Express: E-MTAB-1724), as described in Methods, using the published pre-processed datasets and sample information based on personal communications with Ferreira et al. All probes (a) or the highest-intensity exons mapping to genes (b) overlapping with the 77 genes were summed. (a) Black, strongly enterovirus-positive blood samples; white, weakly enterovirus-positive blood samples; grey, enterovirus-negative blood samples. (a, b) PreSero, samples collected from before seroconversion from children with autoantibody positivity or type 1 diabetes (in a, n = 22; in b, n = 65); PostSero, samples collected after seroconversion from children with autoantibody positivity or type 1 diabetes (in a, n = 169; b n = 84), Aab−, samples collected from autoantibody-negative children (in a, n = 165; in b, n = 305). (c) Venn diagram showing the overlaps between the 77 genes present in the enterovirus-induced signature and upregulated in all three in vitro enterovirus infections; genes upregulated before or after seroconversion in autoantibody-positive children based on the results by Kallionpää et al [15] and the 225 interferon-inducible genes detected by Ferreira et al [27]

