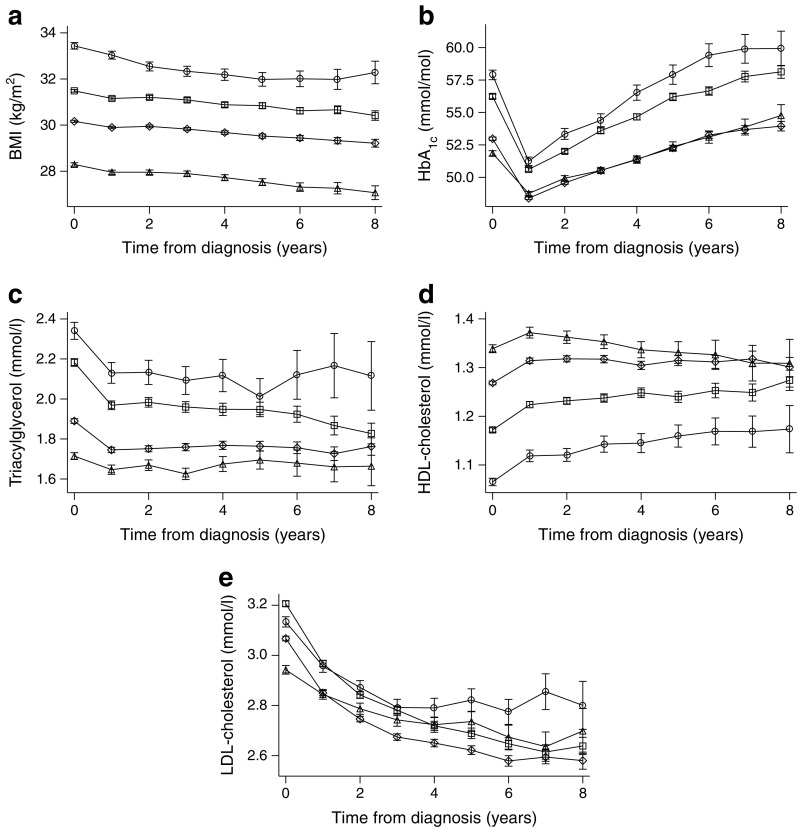
Fig. 1.
Yearly averages (95% CI) stratified by age group for (a) BMI, (b) HbA1c, (c) triacylglycerol, (d) HDL-cholesterol and (e) LDL-cholesterol. White circles, 18–44 years old; plus sign (+), 45–59 years old; crosses (×), 60–74 years old; white triangles, ≥75 years old. All analyses, p < 0.05 where 95% CI do not overlap

