
Fig. 2.
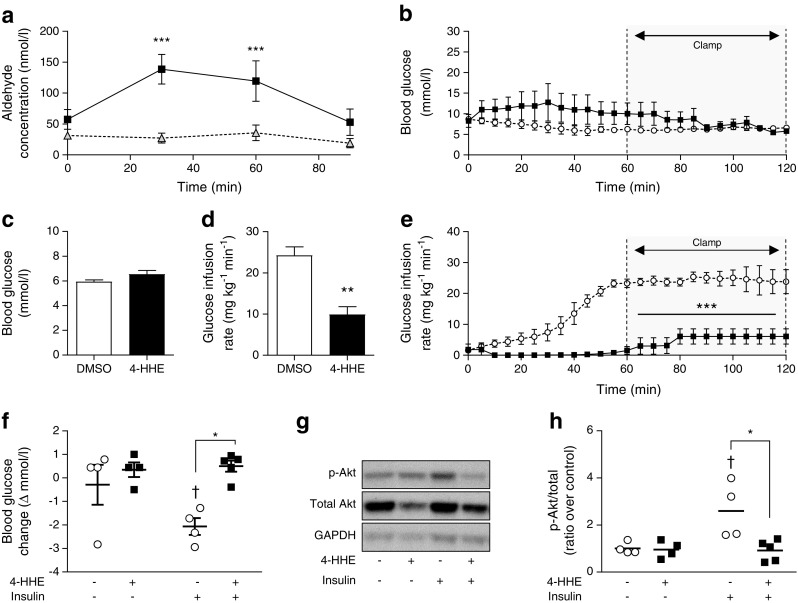
4-HHE infusion induces insulin resistance in rats. Euglycaemic–hyperinsulinaemic clamps were performed in anaesthetised Wistar rats infused with 4-HHE (10 mg/kg i.v.) or vehicle (DMSO) as described in Methods. (a) 4-HHE (black squares) and 4-HNE (grey triangles) concentration in 4-HHE-infused rats, measured in plasma over the 2 h of the clamp experiment. Results are means±SEM, n = 4. ***p < 0.001 vs time zero. (b) Blood glucose was monitored every 5 min using a glucometer and glucose infusion rate was adjusted accordingly. (c, d) Mean blood glucose (c) and glucose infusion rate (d) during the second hour of clamp. (e) In a separate experiment, rats were injected with 4-HHE (n = 5) or DMSO (n = 4) and after 2 h stimulated with insulin for 20 min; during euglycaemic–hyperinsulinaemic clamp, glucose infusion rate was adjusted accordingly over 2 h. (f) Blood glucose levels were measured with a glucometer. (g, h) Representative western blot (g) and quantification (h) of insulin-induced phosphorylation of Akt following 4-HHE and insulin injections. Data are means±SEM, n = 4. *p < 0.05, **p < 0.01 and ***p < 0.001 for indicated comparisons or vs DMSO; †p < 0.05 vs no insulin (d–f, h). Black squares and bars, rats infused with 4-HHE; white circles and bars, rats infused with DMSO control