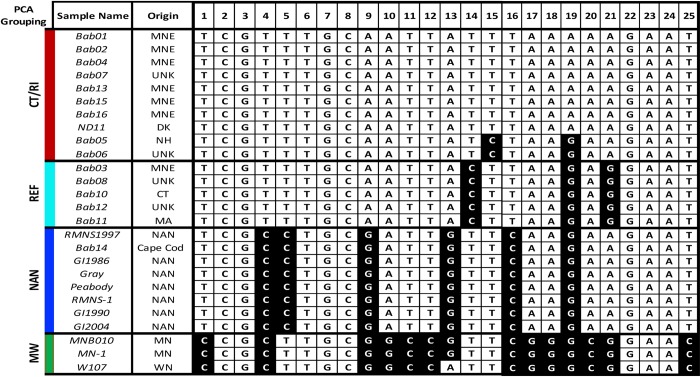
Fig 2. The 25-SNP barcode identifies distinct barcode signatures segregating B. microti into distinct lineages.
The resultant 25-SNP barcode is shown for each sample. The top row lists the sample origin and assay number. The major allele is shown in white and the minor allele shown in black. The samples are grouped according to similar or identical barcodes and according to geographic origin Mainland New England (MNE), Reference 1 group (REF), Nantucket (NAN), and the Midwest (MW). The SNP genotyping was 100% successful (650 out of 650 SNP calls).

