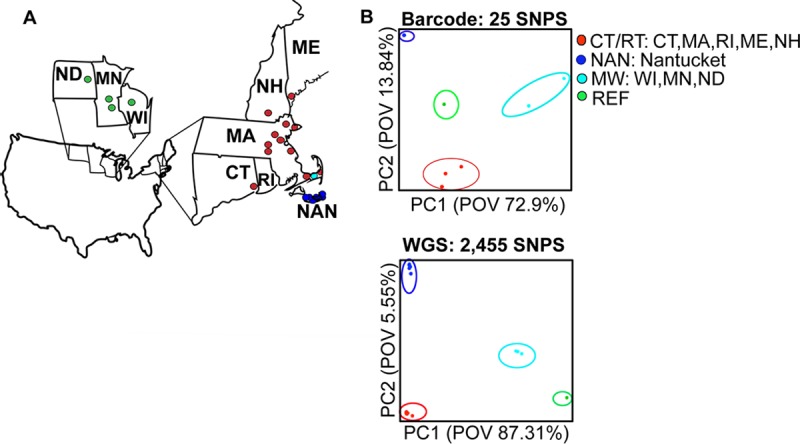
Fig 3. The 25-SNP barcode classifies samples by geographic origin.

A) The map illustrates the four geographic origins of the samples Mainland New England (MNE—Massachusetts, Connecticut, New Hampshire, Maine, and Rhode Island) Midwest (MW—Minnesota and Wisconsin), and Nantucket with the approximate location of the sample indicated by a circle. B) The upper PCA plot shows the 25-SNP barcode separates the 26 babesiosis clinical samples into four geographic origins Mainland New England (MNE—Massachusetts, Connecticut, New Hampshire, Maine, and Rhode Island) Midwest (MW—Minnesota and Wisconsin), and Nantucket (POV = 72.92) and is comparable to lower PCA plot that shows all 2,445 SNPs (POV 87.31).
