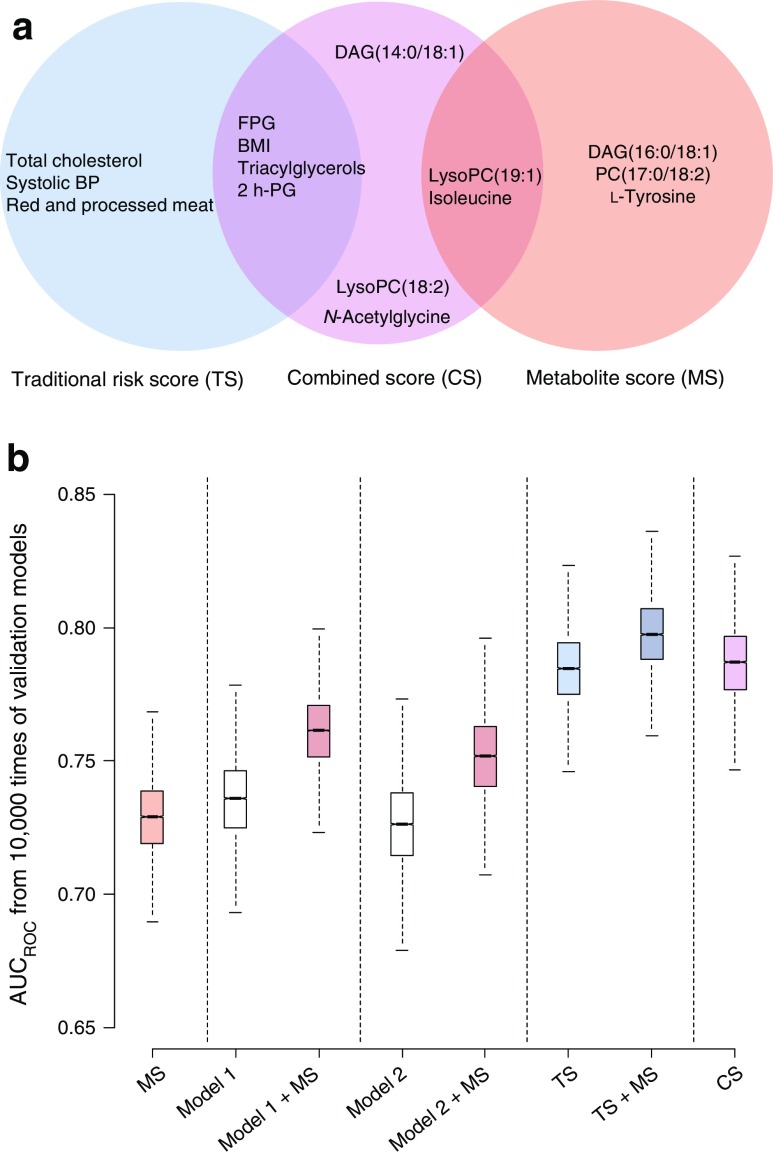
Fig. 3.
Comparison of the prediction performance of clinical risk factors, metabolites and their combinations for risk of type 2 diabetes. (a) Optimally selected subset of predictors, employing a validated random forest algorithm, for TS, CS and metabolite score (MS). (b) Prediction performance of different models trained from metabolites, traditional risk factors and their combinations. AUCROC values were obtained from 10,000 models where the samples were randomly split into training (60%) and test sets (40%) for prediction and validation; the AUCROC values were 0.73 (95% CI 0.69, 0.76) for MS, 0.74 (95% CI 0.70, 0.77) for model 1, 0.77 (95% CI 0.73, 0.79) for model 1 + MS, 0.72 (95% CI 0.67, 0.74) for model 2, 0.75 (95% CI 0.72, 0.78) for model 2 + MS, 0.78 (95% CI 0.76, 0.81) for TS, 0.80 (95% CI 0.77, 0.83) for TS + MS and 0.79 (95% CI 0.76, 0.82) for CS. Adding an MS to model 1 resulted in a continuous net reclassification improvement (NRI) of 0.85 (95% CI 0.73, 0.95) and an integrated discrimination improvement (IDI) of 0.16 (95% CI 0.14, 0.19) (p < 0.001 for both analyses), and to model 2 NRI 0.76 (95% CI 0.65, 0.88) and IDI 0.12 (0.09, 0.14) (p < 0.01 for both analyses), indicating a significant improvement in risk stratification. Adding MS to TS resulted in a marginal increase in risk stratification (NRI 0.52 [95% CI 0.40, 0.64], p < 0.05; IDI 0.03 [95% CI 0.02, 0.04]; p > 0.05)

