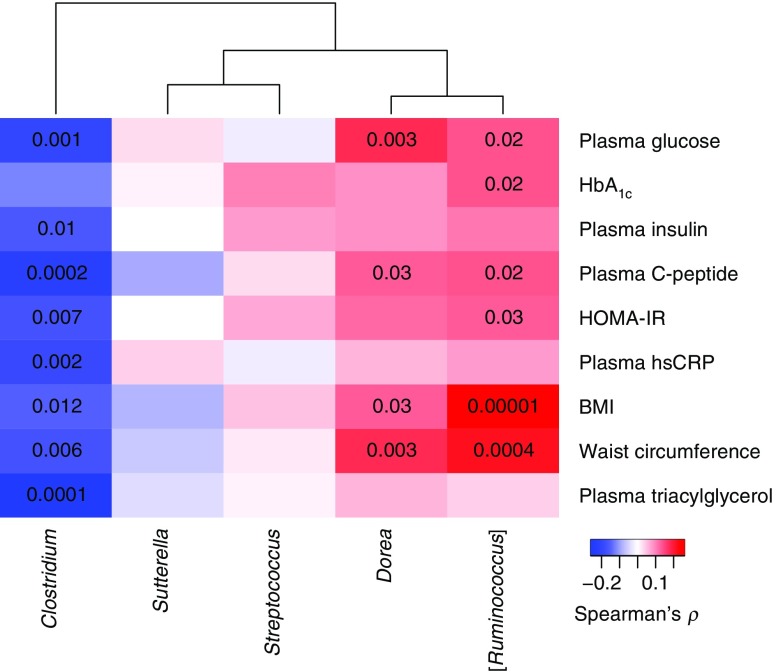
Fig. 2.
Association between differentially abundant genera and clinical biomarkers relevant for diabetes in the total group of 268 individuals. The genera names are from the Greengenes database. The colour key indicates Spearman’s ρ and the numbers in the cells represent p values <0.05. Spearman’s ρ and associated p values are listed in ESM Table 4

