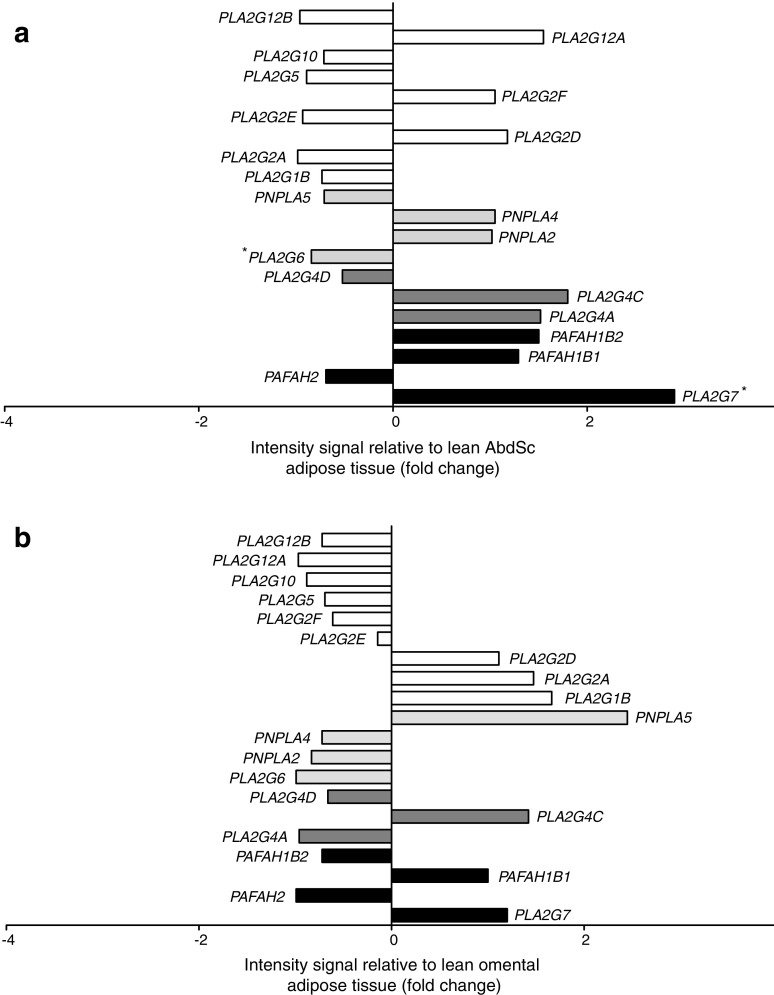
Fig. 1.
Microarray data analysis of the PLA2 gene family. The data are represented as a ratio between intensity signal from lean and obese (a) AbdSc adipose tissue and (b) omental adipose tissue. Statistical analysis was performed using one-way ANOVA. White bars, secretory PLA2; light grey bars, cPLA2; dark grey bars, iPLA2; black bars, platelet-activating factor acetylhydrolase. *p < 0.05

