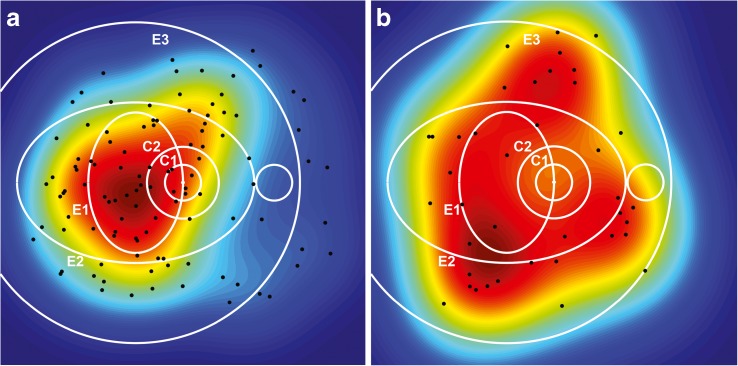
Fig. 3.
Probability density functions obtained with kernel density estimation for the locations of early red lesions from participants with (a) and without (b) progression. The colour scale ranging from blue (lowest values) to dark red (highest values) represents the surface under which the area has a total of 1 in each diagram. The black dots represent the locations of the observed red lesions. The circular (C1, C2) and elliptical (E1, E2, E3) regions described by Hove et al [19] are shown in white for reference

