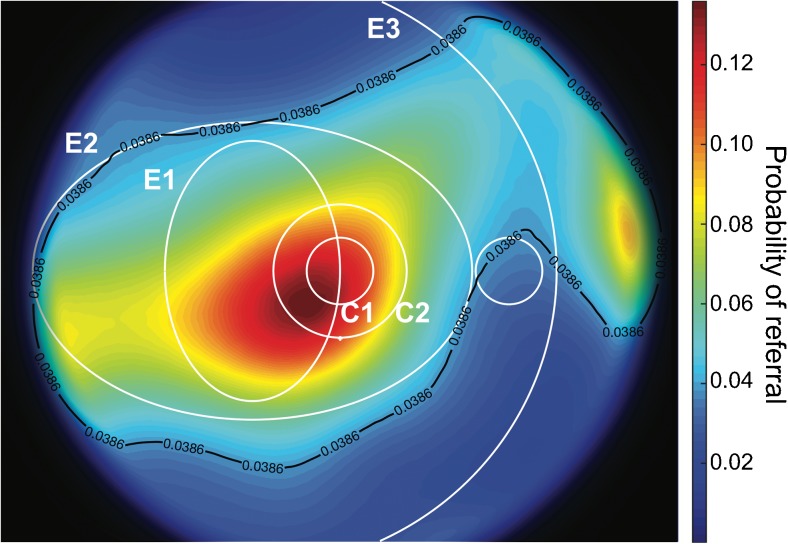
Fig. 4.
The probability of progression to vision-threatening diabetic retinopathy as a function of the location of the initial lesion. The black line represents the average probability of progression estimated from the database of the screening programme for diabetic retinopathy. The circular (C1, C2) and elliptical (E1, E2, E3) regions described by Hove et al [19] are shown in white for reference

