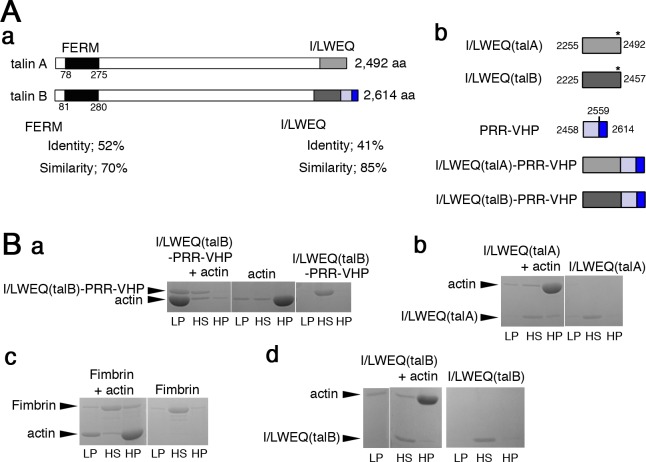
Fig 3. Biochemical analysis of the actin-binding domains of talin A and talin B.
(A) (a) Schematic representations of talin A and talin B. The FERM domains of both talins are shown in black, I/LWEQ(talA) and I/LWEQ(talB) in light and dark gray, respectively, the proline-rich region in light blue, the VHP domain in blue. Sequence identities and similarities between the two FERM domains as well as the two I/LWEQ domains were calculated with the Blast2 program and are indicated under the illustrations. (b) Schematic representations show boundaries of C-terminal domains in each talin and structures of C-terminal talin fragments. Each domain is indicated by different colors as shown in (a). Numbers refer to amino acid positions of the boundaries. Asterisks indicate approximate positions of the dimerization motifs in I/LWEQ. The sequence alignment between I/LWEQ(talA) and I/LWEQ(talB) is displayed in S2A Fig, which also shows key amino acid residues for dimerization [16]. (B) Cosedimentation of I/LWEQ(talB)-PRR-VHP (a), I/LWEQ(talA) (b), Fimbrin (c), and I/LWEQ(talB) (d) with actin filaments was examined by low and high speed centrifugation. Sedimentation of each actin-binding protein without actin was also tested. Pellet samples after low and high speed centrifugations (LP and HP) and supernatant samples after high speed centrifugation (HS) were analyzed by SDS-PAGE.

