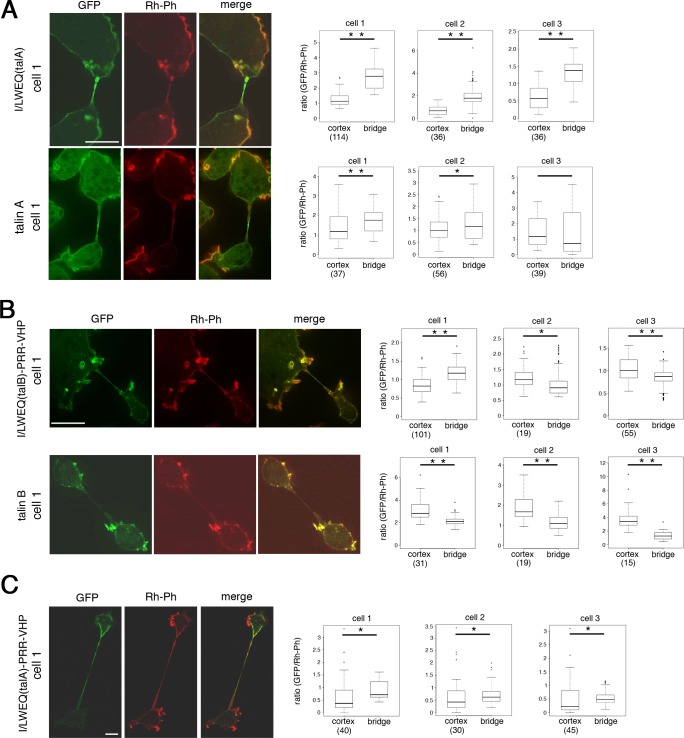
Fig 6.
Stretching actin filaments affect the localization of talin A, talin B, and their actin-binding domains. Confocal images showing the distribution of GFP fusion proteins and actin filaments in dividing myosin II-/talin A-null cells expressing talin A-GFP, GFP-I/LWEQ(talA), and GFP-I/LWEQ(talA)-PRR-VHP (A,C, left), and dividing myosin II-/talin B-null cells expressing GFP-talin B or GFP-I/LWEQ(talB)-PRR-VHP (B, left). Cells of each line undergoing cytofission were fixed and stained with rhodamine-phalloidin (Rh-Ph) to visualize actin filaments. Merged images to demonstrate the relative abundance of GFP fusion proteins to actin filaments are also displayed. Only a small fraction of myosin II-/talin A-null cells expressing GFP-I/LWEQ(talA) underwent cytofission, consistent with our earlier report showing that efficient cytofission requires talin A [45]. Box plots show statistical analysis of three representative cells in each cell line, comparing fluorescence intensities of the GFP signals relative to the Rh-Ph signals between the cytoplasmic bridge and the cell cortex within one cell. Box plots for cell 1 of each line were obtained from the images shown on the left (cell 1). Images of cells 2 and 3 are shown in S3 Fig. Fluorescence intensities of GFP and Rh-Ph signals along the cytoplasmic bridge were measured by Image J software. For the cortical region, the fluorescence intensities in representative pixels along the plasma membrane were measured. Each representative pixel was within a distance of 10 pixels along the x or y axis to its nearest representative pixel and the total number of pixels measured for each cell, which depended on cell size, is indicated in parentheses in box plots. Boxes represent median +/- interquartile range and whiskers are confidence intervals that denote 10th-90th percentiles. Significance was tested using the two-sided Wilcoxon matched-pairs signed rank test. *: p < 0.05, **: p < 0.001. Scale bars: 10 μm.

