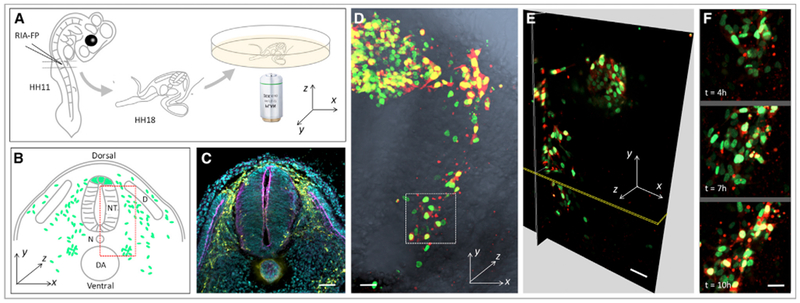
Figure 1. Live Imaging on Migrating Neural Crest Cells within Chick Embryonic Slices.

(A) Experimental setup. RIA virus encoding the fluorescent protein (FP) of interest was introduced into the chick neural tube at stage HH11. At stage HH18, a transverse slice at the forelimb level was transferred into the imaging dish for time-lapse imaging.
(B) Schematic diagram showing the general morphology of the sliced embryo and the coordinate axes used for quantitative analysis. The green dots and red dashed box depict migrating cells and the region imaged, respectively. NT, neural tube; D, dermomyotome; N, notochord; DA, dorsal aorta.
(C) Immunofluorescence of a frozen section to show the distribution of migrating trunk neural crest cells (HNK-1 positive, yellow) at stage HH18. The anatomical structure of the embryo was highlighted by phalloidin (magenta) and DAPI (cyan) staining to label F-actin and the nucleus, respectively. Scale bar, 100 μm.
(D–F) 4D (xyz and t) visualization of cell migration (n = 2 tissue slices).
(D) One selected time frame of a time-lapse video on a tissue slice expressing H2B-GFP (green) and mCherry (red), which was merged with phase-contrast image (gray) showing the in vivo context.
(E) Three orthogonal sections of the 3D-rendered image in (D).
(F) Representative snap shots of the selected region (white box in D).
Scale bars: (D and E) 25 μm; (F) 15 μm. The signal intensity of the images in (F) was adjusted from the corresponding video to present cell morphologies more clearly.
