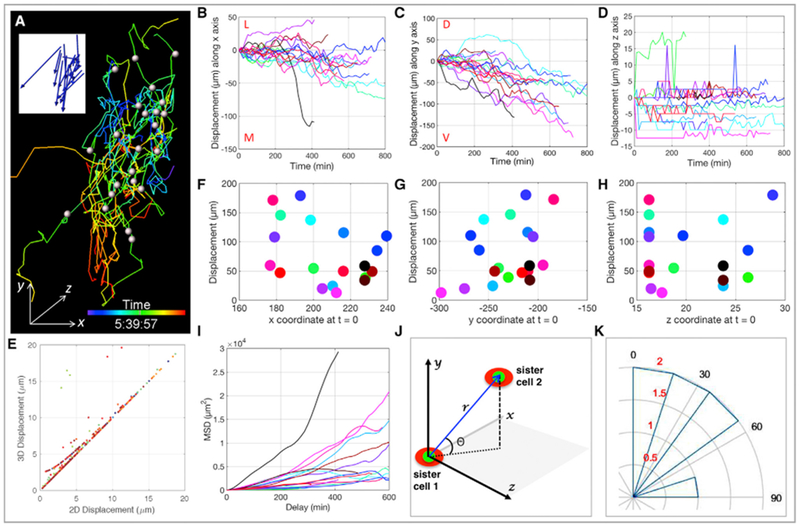
Figure 2. Neural Crest Cells Display a Biased Random Motion.

(A) Migrating cells were spot segmented with the white dots representing their centers at t = 0 and the corresponding cellular trajectories color-coded according to time. The blue arrows in the insert depict the final displacement directions of the cells.
(B–D) Track displacement lengths over time along x (B), y (C), and z (D) axes with each line representing the trajectory of one cell (n = 21). Maximal and minimal displacements were observed in the y (C) and z directions (D), respectively. M, L, D, and V stand for medial, lateral, dorsal, and ventral, respectively.
(E) Pearson correlation analysis shows the coordination between 2D (xy) and 3D (xyz) cell displacements.
(F–H) Total track displacement length as a function of cell initial position along x (F), y (G), and z (H) axes with each dot representing one cell. The random distribution (R2 = 0.1356) of the dots implies a lack of correlation.
(I) Mean square displacement (MSD) analysis of cell trajectories reveals all three modes of motion: directed (α > 1), free diffusion (α ≈ 1), and constrained (α < 1), highlighting the heterogeneous nature of cell migration.
(J and K) Neural crest cells did not divide along the DV axis of embryos.
(J) Coordinate system used to measure the orientation of cell division. r is the 3D distance between nucleus (green) of daughter cells (red), and θ is the angle between r relative to the xz plane.
(K) The orientation of mitosis was estimated based on the quadrant in which it was located. Angular histogram illustrates division angles, and the concentric rings are in correspondence to cell number colored in red (n = 7).
