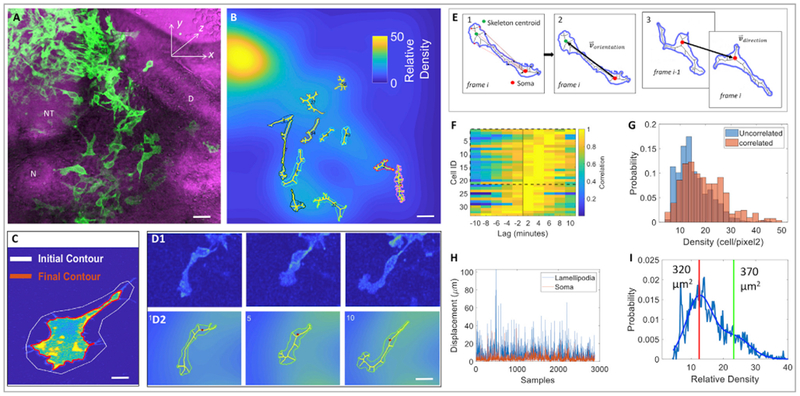
Figure 3. Neural Crest Migration Is Influenced by the Lamellipodium, Cell Morphology, and Cell Density.

(A) A selected time frame of a time-lapse imaging on a tissue slice expressing membrane-YFP (green) (n = 2 tissue slices); it was merged with phase contrast image (magenta) showing neighboring tissues. NT, neural tube; D, dermomyotome; N, notochord. Scale bar, 15 μm.
(B) A selected 3D image of the same video in which segmented cells were filled with skeletons. Each cell was encoded with a distinct color for convenience of visual tracking of cell locomotion in the corresponding videos. The background of the image was further color-coded according to the relative cell density, defined as a Gaussian smoothed fluorescence intensity of membrane-YFP per pixel. Scale bar, 15 μm.
(C) Cell-surface segmentation in which the white line was the initial user defined contour, and the red line was the computer-generated contour of the cell. Scale bar, 3 μm.
(D) Representative snapshots of a migrating cell selected from (A) with pseudocolor based on fluorescence intensity (D1) and filled with skeleton (D2). Scale bar, 5 μm.
(E) Quantitative analyses of the orientation of lamellipodia and the direction of cell migration. (1) The contour was filled with a skeleton and the distance was calculated between the cell body/soma (centroid depicted as a big red dot) and all skeletal points (depicted as small red dots)that connect to cell protrusions. The three skeletal endpoints furthest from the cell body were identified to draw a polygon, which is the lamellipodium (its centroid is depicted as a green dot). (2) The orientation vector, depicting cell morphology, was generated by drawing a black line between the centroids of cell body and the lamellipodium. (3) The direction vector, depicting the direction of cell migration, was drawn between the cell body centroids one time frame apart. The change of the angle between the orientation vector and direction vector was used to assess the correlation between lamellipodial orientation and cell motion direction.
(F) Cell enlargement and displacement occurred in a sequential order. Cross-correlogram analysis of the area and cell body velocity over time revealed that the cell body and area only changed in a synchronized manner in a small fraction of cells (6% show symmetric cross-correlograms, Jarque-Bera test p < 0.05, n = 78). For the remaining cells with statistically significant cross-correlograms, 65% showed asymmetric cross-correlograms in which cell enlargement preceded cell movement (rank-sum test p < 0.05, n = 33).
(G) The lamellipodial orientation and direction of cell migration were positively correlated in a region with intermediate cell density. Cells whose direction and orientation vector were positively correlated (p < 0.05) were presented near the regions of relatively high density (average density when correlated 18 ± 9 vs. 14 ± 7 when not correlated, rank-sum test p < 10−21).
(H) The lamellipodium was more dynamic than the cell body. Over time, pixel shifts (the readout of displacement) of the lamellipodia were larger than cell bodies (median ± SD, soma: 2.7 ± 4.8 μm versus lamellipodia: 6.7 ± 6.7 μm, rank-sum test p < 10−280) and these changes were largely uncorrelated (0.08 correlation, p = 10−6).
(I) Cell size and regional density were negatively correlated. Cells in lower density areas (left of vertical red line) were significantly smaller than cells in higher density (left of red vertical line, median: 320 μm2 vs. 370 μm2; rank-sum test p = 10−14).
