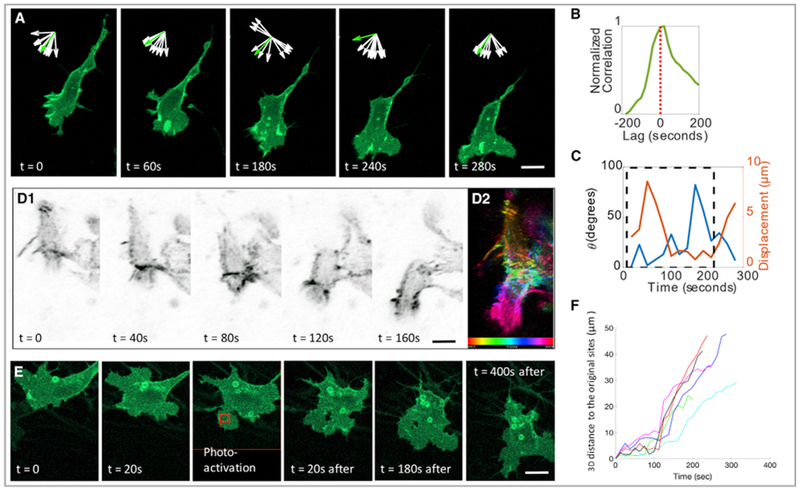
Figure 4. Neural Crest Migration Is Directed by the Lamellipodium in a Neighbor-free Zone.

(A) Focusing on single cell at high resolution, the lamellipodium (membrane-YFP, green) was located on the leading edge of a migrating cell in a neighbor-free zone. Inset arrows show the normalized orientation of 10 skeleton endpoint (white) and the displacement vector (green) of cell body over time, suggesting the coordinated relationship between these two cellular factors. Scale bar, 5 μm.
(B and C) Quantitative analysis of the cell in (A) confirmed the coordinated relationship between lamellipodia and cell migration.
(B) Cross correlation between area change and soma displacement; a positive lag suggests that area increases prior to cell body displacement.
(C) Angle between the lamellipodium orientation and displacement vector (blue) and cell displacement (orange) were plotted. Maximal cell displacement occurred when both vectors were collinear (blue, θ close to 0). Dashed black rectangle highlights the frames during which the angle and displacement were inversely correlated (coefficient −0.62 and p < 0.05).
(D) Montage of a migrating cell with F-actin (utrophin-scarlet, gray) enriched in the front end of the cell (D1). F-actin distribution was color-coded according to time (D2). Scale bar, 5 μm.
(E and F) In one specific portion (red box) of a stationary cell expressing PA-Rac, photoactivation with a 458-nm laser induced the cell to migrate in the direction of laser illumination (E). Cell trajectory analysis with inflection points of the curves corresponded to the time points of photoactivation (F). (n = 6); two slices were imaged, and the cells were combined for analyses. Scale bar, 5 μm.
