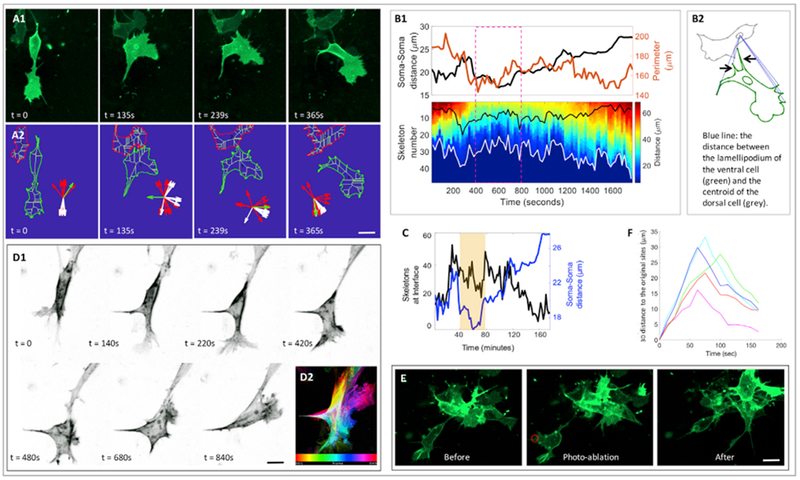
Figure 5. Neural Crest Migration Is Controlled by Cell-Cell Contact Attraction.

(A) Snap shots of contact attraction with both fluorescence (A1) and skeleton (A2) view: one cell (membrane-YFP, green) moving in the ventral direction with an elongated body was attracted by another cell on its dorsal side. The front (more ventral) cell became rounder and withdrew its lamellipodium. Subsequently, this front cell acquired its stretched shape and started to move forward. Inset (A2) showed the orientations of ten skeleton endpoints of the ventral cell (green) near to (red) and far from (white) its own cell body, which was further used for quantitative analyses in (B) and (C). Scale bar, 5 μm.
(B) Analyses of cell-cell distance change and cell morphological change of the cells in A. Data analyses (B1): the diagram showing the parameters used in (B1) (B2). Upper graph of (B1): the cell perimeter (orange line) of the ventral cell and its distance to the dorsal cell (black line) as a function of time. It confirmed that the ventral cell was more compacted when two cells were closer to each other (dashed magenta box). Lower graph of (B1) is the kymograph of the distance between the cell protrusions of the ventral cell and the centroid of the dorsal cell (white curve in the kymograph and the blue dashed straight lines in the diagram of B2). Focusing on the dashed magenta in the kymograph, the overall distance decreased as both cells were closer, consistent with the stationary state of the ventral cell upon its contacting with the neighbor. The black curve in the kymograph represented the number of cell protrusions of the ventral cell pointing toward the cell-cell interface (also illustrated in the diagram of B2 pointed by black arrows), which was termed inter-cellular protrusions. Prior to cell-cell association (250–400 s), inter-cellular protrusions increased, a sign of the reorientation of the lamellipodium; when the cells touched each other (400–1,300 s), these protrusions diffused around the cells and only a fraction was at the interface; after frame 1,300 s, the number of these protrusions decreased, consistent with the observation that the ventral cell moved away.
(C) Cell-cell distance change (blue curve) and the percentage of inter-cellular protrusions among total protrusions (black curve). The change of this percentage suggests that the ventral cell is more compact, and its protrusions are more uniformly distributed upon its associating with the neighbor.
(D) Montage of a front cell in which F-actin (utrophin-scarlet, gray) progressively moved to the other end of the cell (D1). F-actin distribution was color-coded according to time (D2). Scale bar, 5 μm.
(E and F) Lamellipodium generates a pulling force to break cell-cell adhesion. Focusing on a cell (membrane-YFP, green) leaving a cell cluster with a connecting tail (E), laser elimination of the lamellipodium (within the red circle) resulted in the backward motion of this cell. Cell trajectory analysis with the inflection points of the curves corresponded to the time points when laser ablation was applied (F). Two slices were imaged, and the cells were combined for analyses. Scale bar, 5 μm.
