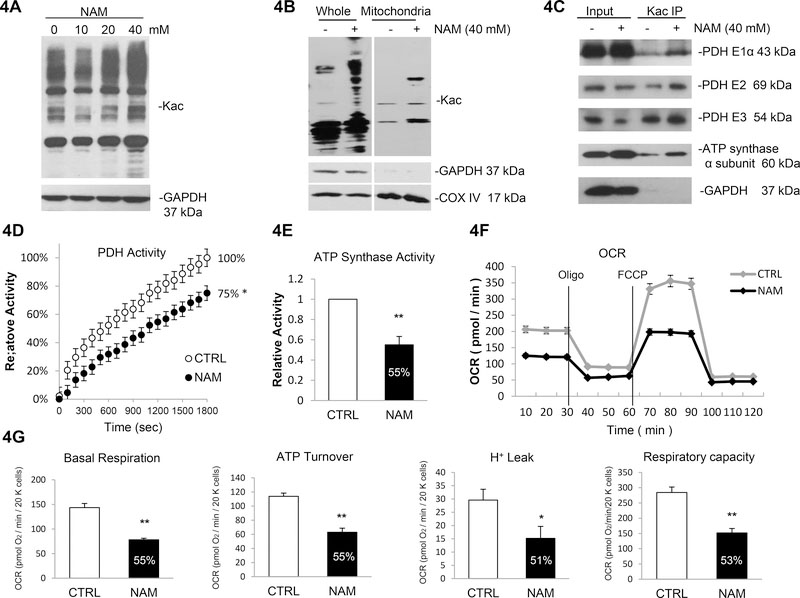
Figure 4. Sirtuin inhibitor Nicotinamide (NAM) induces acetylation of multiple mitochondrial proteins and reduces enzymatic activity.
4A. NAM induced acetylation in AC16 cell line. Cells were treated with increasing concentration of NAM or vehicle (PBS). Global acetylation level was analyzed by western blot. 4B. NAM induces acetylation of mitochondrial proteins. Whole cell lysates and mitochondrial fraction were isolated for western blotting analysis. 4C. Induced acetylation in PDH complex and ATP synthase α subunit in response to NAM treatment. AC16 cells were treated with NAM or vehicle; cell lysates were prepared and subjected to IP assay using anti-Kac. Equivalent amounts of the pellets (IP) were resolved by SDS/PAGE and proteins were detected by immunoblotting. 10% of the cell lysate used in the IP reaction was shown as input. 4D. 25% decrease in PDH activity in response to NAM treatment. PDH activity was measured following 20 h of NAM treatment or vehicle. Errors represent the SD derived from three independent experiments and p<0.05. 4E. 45% decrease in ATP synthase activity in response to NAM treatment. ATP synthase activity was measured following 20h of NAM treatment. Errors represent the SD derived from three independent experiments and p<0.01. 4F. Oxygen consumption rate (OCR) was decreased in NAM treated cells. The AC16 cells were seeded 24 h before analyzed by a Seahorse XF24 Analyzer. The OCR was measured continuously throughout the experimental period at baseline and in the presence of the indicated drugs. Oligo indicates oligomycin (1 μM); FCCP indicates carbonylcyanide p-trifluoromethoxyphenylhydrazone (1 μM); ROT + AA indicate mixture of rotenone (1 μM) and antimycin A (1 μM). 4G. Basal Raspiration, ATP turnover, H+ leak and respiratory capacity were all significantly decreased in NAM treated AC16 cells compared to control. Measurements were made in triplicate (mean ans s.d.), and results are indicative of three independent experiments (p<0.05 or p<0.01). * represents p<0.05, ** represents p<0.01.

