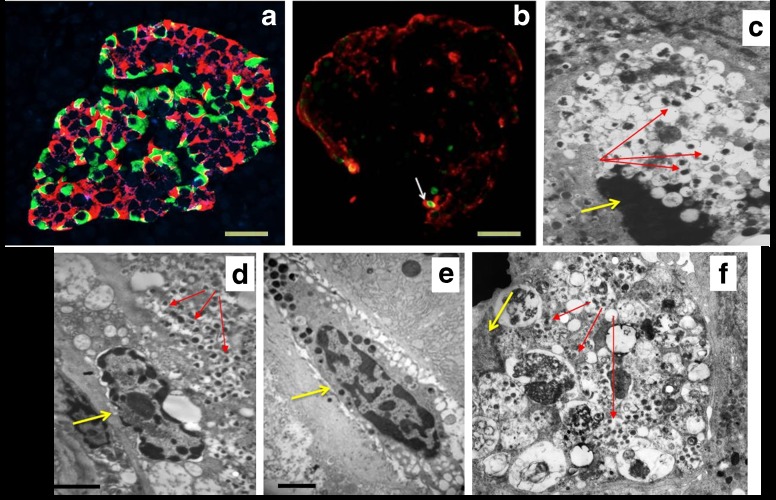
Fig. 1.
Representative images, obtained by light or electron microscopy, of pancreatic samples yielded from organ donors. (a) Immunofluorescence analysis of an islet from a donor without diabetes; insulin containing cells are in red, glucagon containing cells are in green (M. Suleiman, personal communication). (b) Immunofluorescence analysis of an islet containing a beta cell with an apoptotic nucleus (white arrow); insulin containing cells are in red, the apoptotic nucleus is in green (TUNEL staining). Scale bars in (a) and (b), 20 μm. (c) An apoptotic beta cell visualised by electron microscopy; the yellow arrow indicates an apoptotic nucleus with marked chromatin condensation, the red arrows indicate insulin granules. Magnification ×10,000. (d, e) Electron micrograph showing immune cells infiltrating the pancreas. In (d), the yellow arrows indicate a macrophage and red arrows indicate insulin granules in a beta cell adjacent to the macrophage. In (e) the yellow arrow points to a mast cell. Scale bars in (d) and (e), 1 μm. (f) Electron micrograph showing a beta cell with signs of death associated with altered autophagy (note the cytoplasm engulfed with lysosomes [multigranular bodies]); the yellow arrow indicates the nucleus without evidence of apoptotic features, the red arrows point to some remaining insulin granules. Magnification ×7000. Figure parts (b), (d) and (e) adapted from [29] with permission from Springer Nature, copyright 2015; figure parts (c) and (f) adapted from [31] with permission from Springer Nature, copyright 2009

