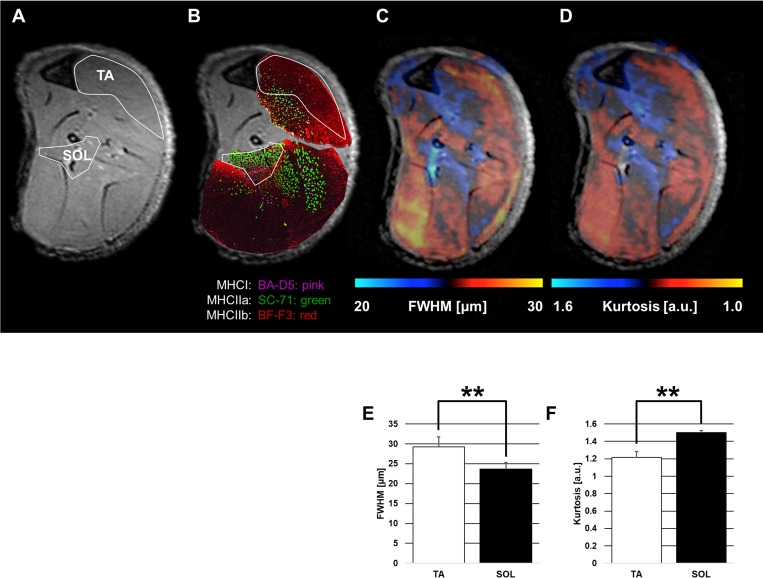
Fig 4. Comparison of the immunohistological findings and qsi findings in the tibialis anterior muscle (TA; fast muscle fiber) and soleus muscle (SOL; slow muscle fiber).
A: Regions of interest on axial T2-weighted imaging (T2WI; low power field) with the largest calf circumference as reference. B: Immunohistological findings (low power field, ×1) on axial T2WI. The legions of TA and SOL at Fig 4A are shown. TA is mainly composed of BF-F3-positive cells and SOL is composed of BA-D5-positive cells and SC-71-positive cells. BA-D5-positive cells, pink; SC-71-positive cells, green; and BF-F3-positive cells, red C: Full width at half maximum (FWHM) map on axial T2WI. The bright blue (low FWHM) lesion is consistent only at the SOL lesion. D: Kurtosis map on axial T2WI. The white (high Kurtosis) lesion is consistent only at the SOL lesion. E: FWHM findings for each muscle (TA and SOL). F: Kurtosis findings for each muscle (TA and SOL). The end of the whisker represents standard deviation. **P < 0.01 Student’s t-test was used to evaluate the relationship between the TA (fast muscle fiber) and SOL (slow muscle fiber) with regard to qsi parameters (FWHM and Kurtosis).

