. 2019 Apr 4;8:e43944. doi: 10.7554/eLife.43944

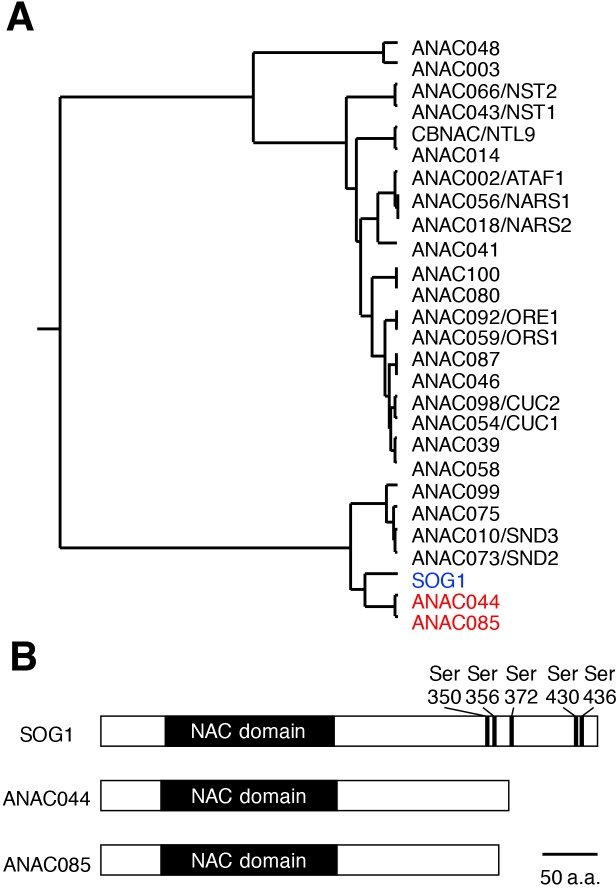
Figure 1. Similarities among SOG1, ANAC044 and ANAC085.

(A) Phylogenetic tree of the NAC transcription factors in Arabidopsis. SOG1 (blue letters) and ANAC044 and ANAC085 (red) are highlighted. (B) Protein structures of SOG1, ANAC044 and ANAC085. Serine (Ser) residues of the SQ motifs in SOG1 are indicated with numbers of the amino acid sequence.

Figure 1.

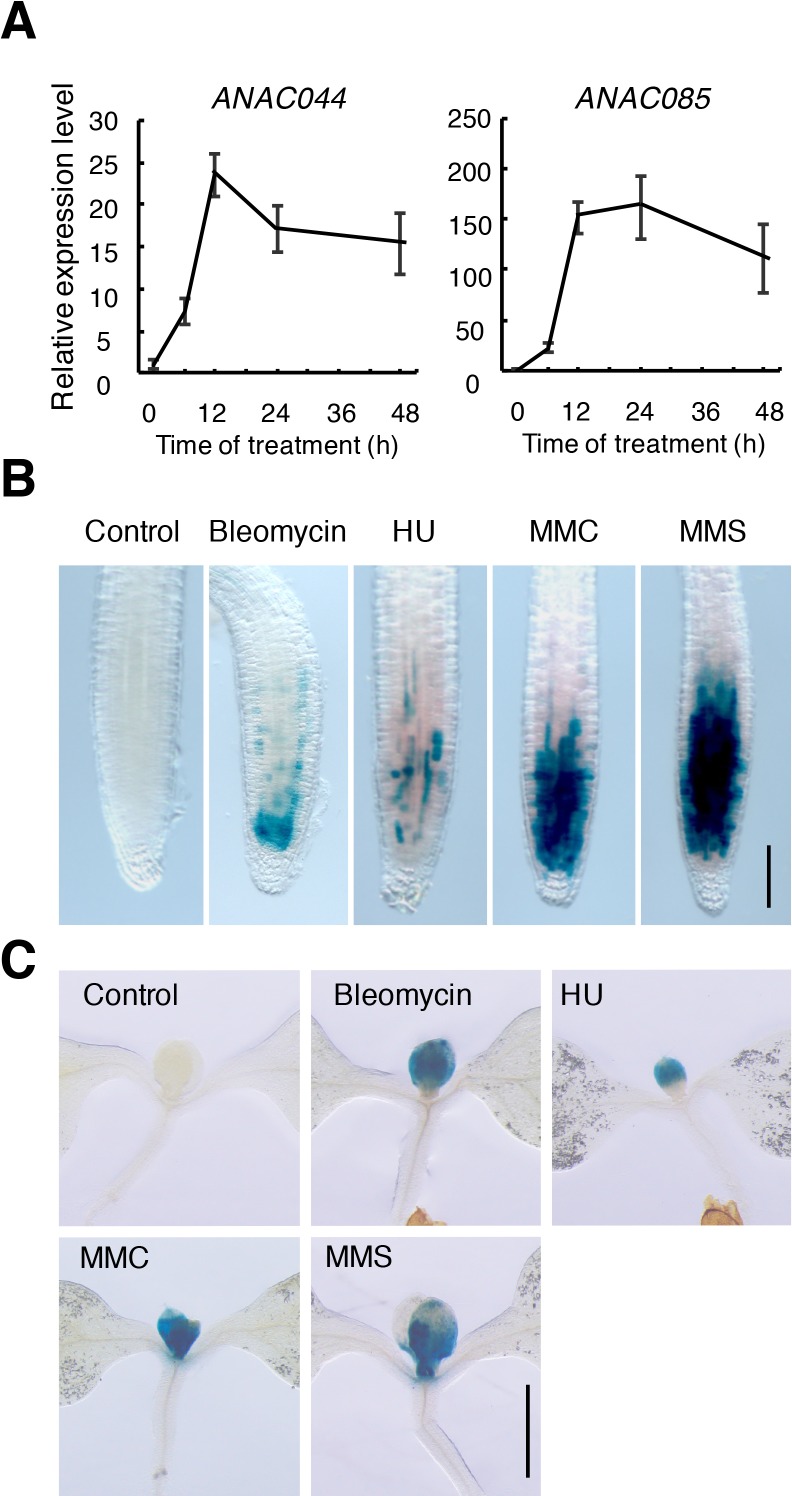
Figure 1—figure supplement 1. ANAC044 and ANAC085 are induced by DNA damage.

Figure 1—figure supplement 1.

(A) Transcript levels of ANAC044 and ANAC085 after bleomycin treatment. Five-day-old WT seedlings were treated with 0.6 µg/ml bleomycin for 0, 6, 12, 24 or 48 hr. The mRNA levels were normalized to that of ACTIN2 and are indicated as relative values, with that for 0 hr set to 1. Data are presented as mean ±SD (n = 3). (B, C) Five-day-old seedlings harbouring ProANAC044:GUS were transferred to medium supplemented with or without 0.6 µg/ml bleomycin, 1.5 mM hydroxyurea (HU), 3.3 µg/ml mitomycin C (MMC) or 80 ppm methyl methanesulfonate (MMS), and grown for 24 hr. GUS-stained seedlings were observed for the root tip (B) and shoot apex (C). Bars = 100 µm (B) and 1 mm (C).
Figure 1—figure supplement 1—source data 1. Source data.
DOI: 10.7554/eLife.43944.005
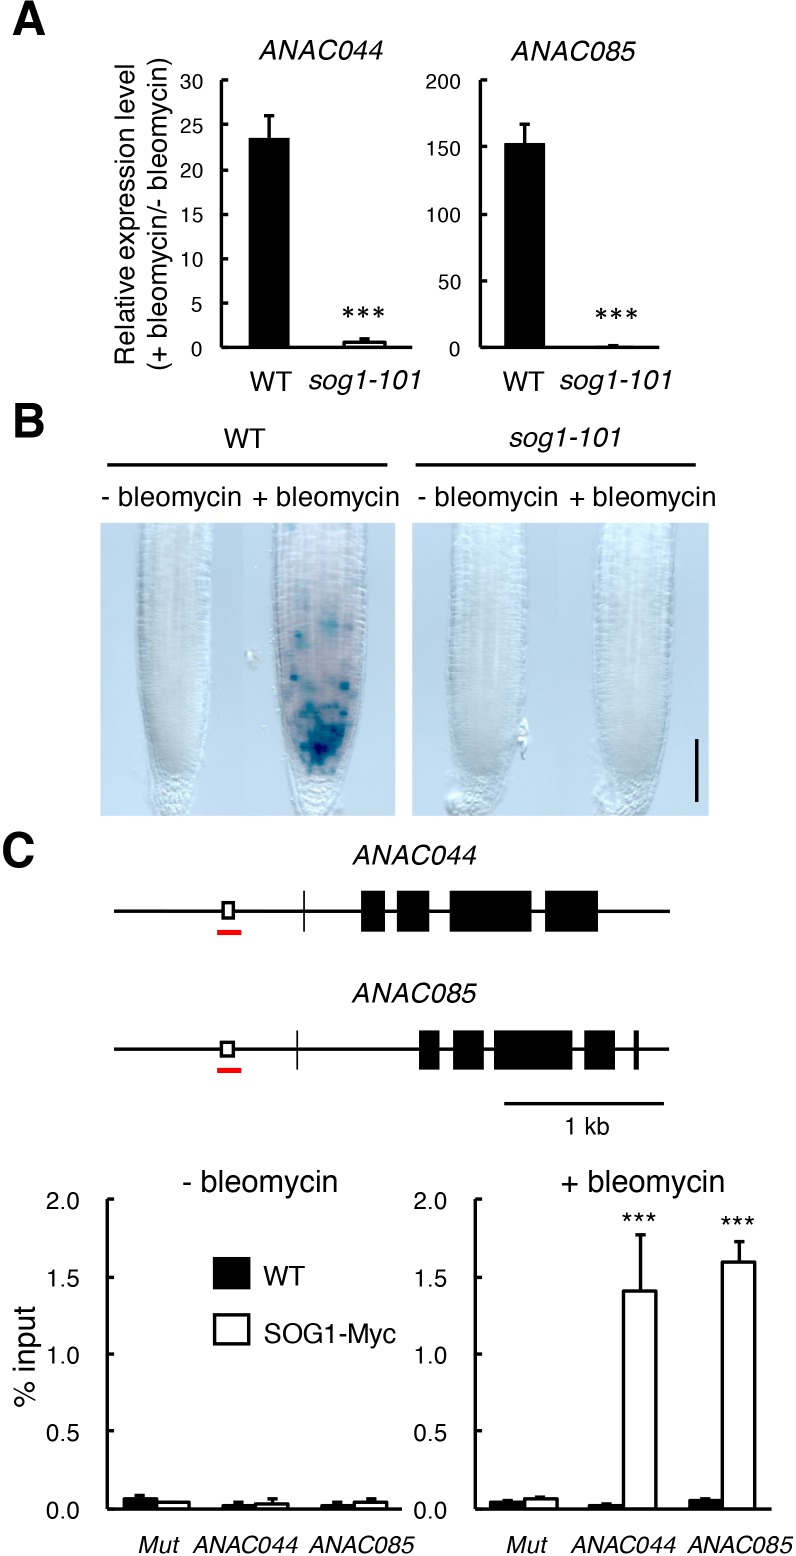
Figure 1—figure supplement 2. SOG1-mediated induction of ANAC044 and ANAC085.

Figure 1—figure supplement 2.

(A) Transcript levels of ANAC044 and ANAC085 in sog1-101. Five-day-old WT and sog1-101 seedlings were treated with or without 0.6 µg/ml bleomycin for 12 hr. The mRNA levels were normalized to that of ACTIN2 and are indicated as fold induction following bleomycin treatment. Data are presented as mean ± SD (n = 3). Significant differences from WT were determined by Student’s t-test: ***, p<0.001. (B) Promoter activity of ANAC044 in the root tip. Five-day-old seedlings of WT and sog1-101 carrying ProANAC044:GUS were transferred to MS medium with or without 0.6 µg/ml bleomycin and cultured for 24 hr, followed by GUS staining. Bar = 100 µm. (C) (Upper) Schematic representation of the genomic regions of ANAC044 and ANAC085. Open and closed boxes indicate SOG1-binding motifs and exons, respectively. Red lines represent the regions amplified in ChIP-qPCR. (Lower) ChIP-qPCR assay. Two-week-old WT and ProSOG1:SOG1-Myc (SOG1-Myc) seedlings were treated with or without 0.6 µg/ml bleomycin. Chromatin bound to SOG1-Myc was collected by immunoprecipitation with anti-Myc antibodies, and qPCR was conducted to amplify the promoter regions of ANAC044 and ANAC085. Mutator-like transposon (Mut) was used as a negative control. The recovery rate of each DNA fragment was determined against input DNA. Data are presented as mean ± SD (n = 3). Significant differences from WT were determined by Student’s t-test: ***, p<0.001.
Figure 1—figure supplement 2—source data 1. Source data.
DOI: 10.7554/eLife.43944.007