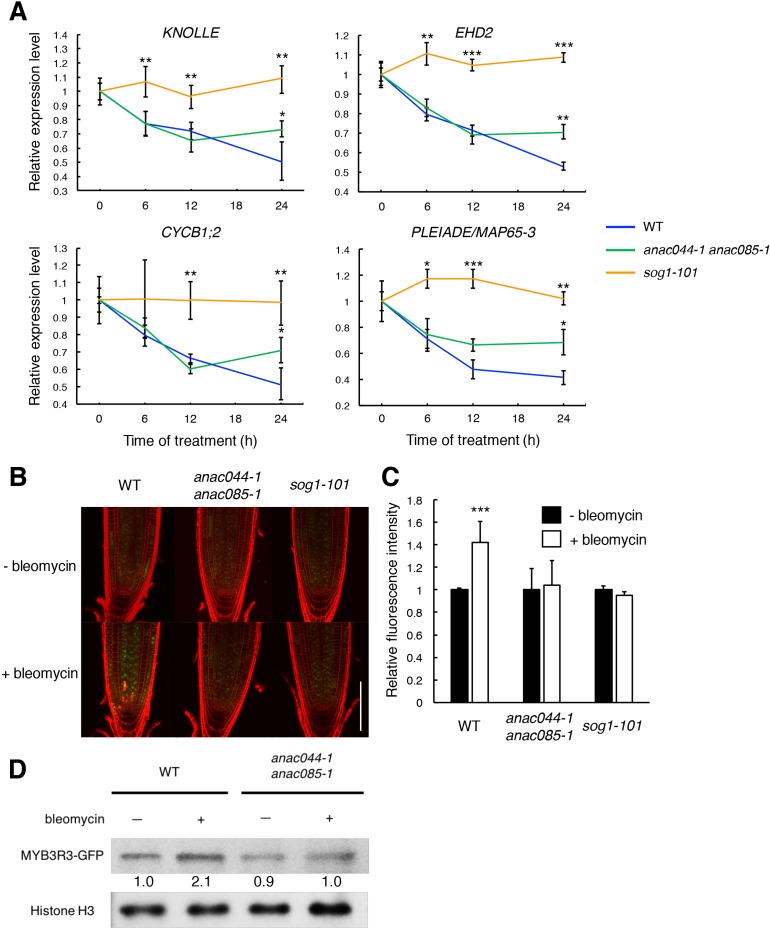
Figure 6. ANAC044 and ANAC085 promote Rep-MYB accumulation in response to DNA damage.
(A) Transcript levels of KNOLLE, CYCB1;2, EHD2 and PLEIADE/MAP65-3 after bleomycin treatment. Five-day-old seedlings of WT, anac044-1 anac085-1 and sog1-101 were transferred to MS medium containing 0.6 µg/ml bleomycin, and grown for 0, 6, 12 and 24 hr. Total RNA was extracted from root tips. mRNA levels were normalized to that of ACTIN2, and are indicated as relative values, with that for 0 hr set to 1. Data are presented as mean ± SD (n = 3). Significant differences from WT were determined by Student’s t-test: *, p<0.05; **, p<0.01; ***, p<0.001. (B–D) MYB3R3 accumulation in the root tip. Five-day-old seedlings of WT, anac044-1 anac085-1 and sog1-101 harbouring ProMYB3R3:MYB3R3-GFP were transferred to MS medium supplemented with or without 0.6 µg/ml bleomycin, and grown for 24 hr. GFP fluorescence was observed after counterstaining with PI (B). Bar = 100 µm. Intensities of GFP fluorescence in the root tip are shown as relative values, with that of non-treated control set to 1 (C). Data are presented as mean ± SD (n = 5). Significant differences from the non-treated control were determined by Student’s t-test: ***, p<0.001. Twenty micrograms of total protein extracted from root tips were subjected to immunoblotting using antibodies against GFP or histone H3 (D). Relative levels of MYB3R3-GFP are expressed as fold change, normalized with respect to the corresponding band of histone H3.


