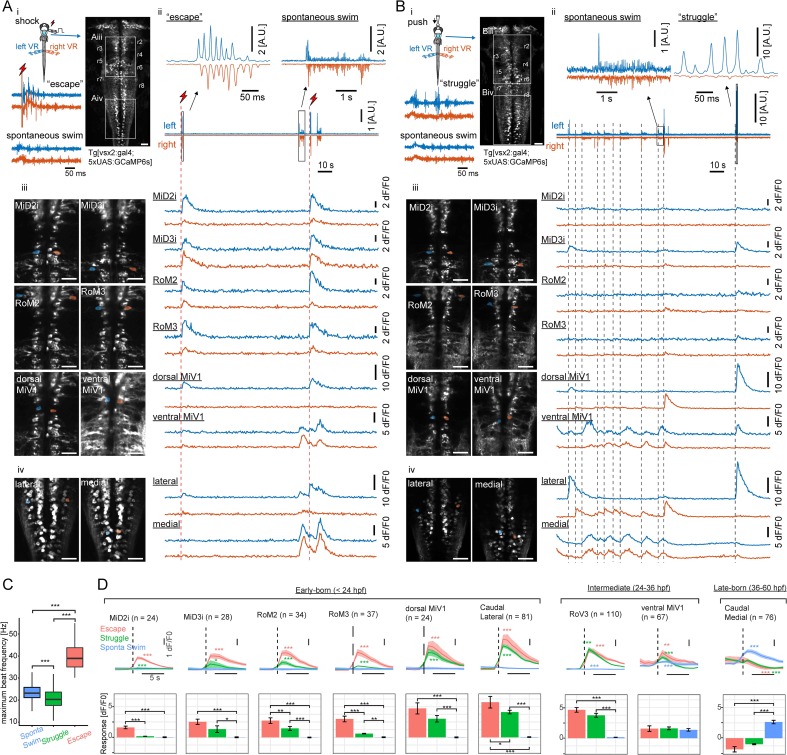
Figure 4. Recruitment of hindbrain V2a neurons during distinct locomotor behaviors.
(A) Ca2+ responses of hindbrain V2a neurons during putative escape induced by a transient electrical stimulus to the head. (i) Experimental setup. The image on the right shows the dorsal view of hindbrain V2a neurons expressing GCaMP6s. White squares indicate the regions displayed in subsequent panels. Hindbrain segments (r2 to r8) were identified based on identifiable V2a reticulospinal neurons. Example raw traces from left and right ventral root (VR) activity during a putative escape and spontaneous swim episode (blue trace, left VR signal; orange trace, right VR signal; red thunder symbol, onset of an electrical pulse). (ii) Example traces of processed swim signals during a spontaneous weak swim episode and shock-induced strong swim episode. (blue trace, processed left VR; orange trace, processed right VR; red thunder mark, shock onset). (ii-iii) Location of hindbrain V2a neurons and corresponding Ca2+ traces during the locomotion patterns shown in panel i (blue, left ROIs and their Ca2+ responses; orange, right ROIs and their Ca2+ responses). Vertical dotted red lines indicate the onsets of the shock stimuli. (ii) Ca2+ traces of rostral V2a neurons (iii) Ca2+ traces of caudal hindbrain V2a neurons. (Scale bars in the images, 30 μm). (B) Ca2+ responses of hindbrain V2a neurons during a putative struggle induced by the gradual mechanical stimulus. The panels are organized as in A. Note the strong and slowly alternating (between left and right) axial motor activity in panel i. (C) Distribution of maximum tail beat frequency in each locomotor pattern (Spontaneous swims, 10,691 episodes; Struggle, 214 episodes; Escape, 183 episodes). Significant differences in maximum tail beat frequency across three locomotor patterns are indicated with asterisks (Dunn’s test, ***p<0.001). (D) Locomotion event-triggered average Ca2+ responses of hindbrain V2a neurons sorted based on their birthdate. Top, Time course of the event-triggered average Ca2+ response (Orange trace, putative escape; Green trace, putative struggle; Blue trace, spontaneous slow swim). Shaded area indicates standard error across replicates for each cell type (n, number of cells). Significant changes from the baselines are indicated with asterisks (paired t-test, *p<0.05, **p<0.01, ***p<0.001). Bottom, Peak amplitude of locomotion event-triggered average Ca2+ response (Orange bar, putative escape; Green bar, putative struggle; Blue bar, spontaneous slow swim). Significant differences in response amplitude across conditions are indicated with asterisks (Tukey test, *p<0.05, **p<0.01, ***p<0.001).

