. 2019 Mar 19;8:e43008. doi: 10.7554/eLife.43008

Figure 1. Reb1 binds DNA and nucleosomes with similar affinities.

(A) Design of the modified ‘601’ nucleosome positioning sequences (NPS) used in this study. Colored rectangles represent the Reb1-binding site at positions P3 (red), P8 (blue), P13 (green) and P18 (gold) within the 601 NPS. The numbers indicate the starting position of the Reb1-binding site (in number of base pairs into the 601 NPS). (B) Cy3 image of the EMSA of Reb1 binding to a 25-bp DNA sequence with (left) or without (right) the Reb1-binding site. (C) Cy5 image of the EMSA of Reb1 binding to P8 nucleosomes with (left) or without (right) the Reb1-binding site. (D) Quantification of the S1/2s determined from the Reb1 EMSAs in panels (B) and (C) and in Figure 1—figure supplement 3 (S1/2 Reb1–DNA + site EMSA = 2.3 ± 0.2 nM, S1/2 Reb1–DNA – site EMSA = 21.7 ± 2.3 nM, S1/2 Reb1–Nuc P3 EMSA = 4.6 ± 0.1 nM, S1/2 Reb1–Nuc P8 EMSA = 1.5 ± 0.1 nM, S1/2 Reb1–Nuc P13 EMSA = 8.5 ± 0.2 nM, S1/2 Reb1–Nuc P18 EMSA = 11.2 ± 0.3 nM, S1/2 Reb1–Nuc P – EMSA = 32.7 ± 0.8 nM). These results show that Reb1 binds nucleosomes and DNA sites specifically with a similar S1/2.

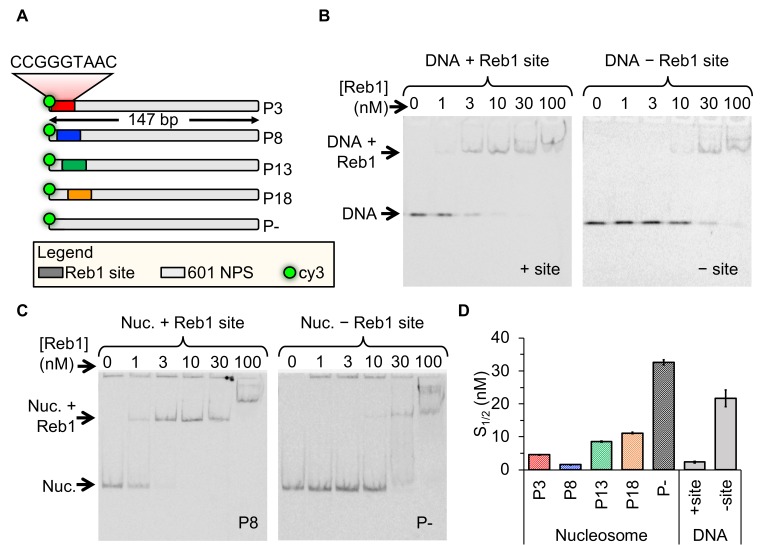
Figure 1.

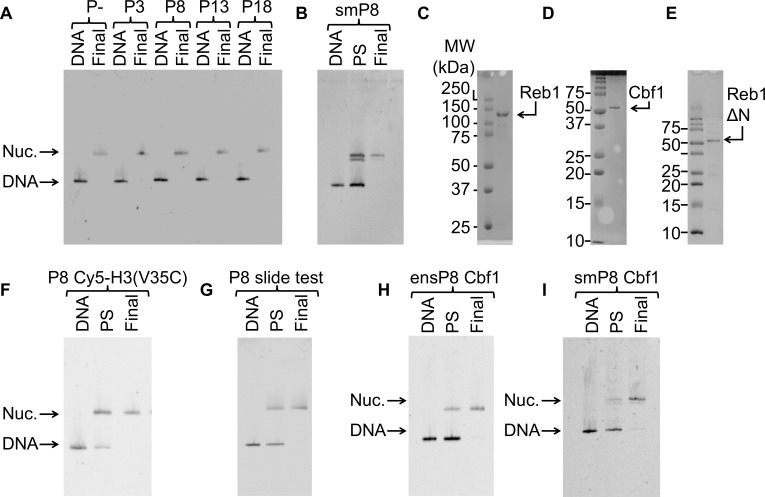
Figure 1—figure supplement 1. Nucleosomes and TFs used in this study.

Figure 1—figure supplement 1.

For all nucleosome gels: ‘DNA’ = free DNA, ‘PS’ = nucleosomes pre-sucrose gradient purification, and ‘Final’ = final nucleosomes used for experiments. (A) Cy3 fluorescence image of the EMSA used to quantify the purity of the 147-bp reconstituted P–, P3, P8, P13 and P18 nucleosomes used in the ensemble Reb1–nucleosome experiments. (B) Cy3 fluorescence image of the EMSA of nucleosomes with the Reb1-binding site and a 75-bp linker used for the single molecule experiments. (C) Image of the the Coomassie-stained SDS-PAGE gel of purified Reb1 used in this study. (D) Image of the the Coomassie-stained SDS-PAGE gel of purified Cbf1 used in this study. (E) Image of the Coomassie-stained SDS-PAGE gel of purified Reb1ΔN used in this study. (F) Cy3 fluorescence image of the EMSA of the nucleosomes labeled with Cy5 at H3(V35C) used for for FRET. (G) Cy3 images of the EMSA of the nucleosomes used to test for Reb1-induced nucleosome repositioning. These nucleosomes contain a Reb1-binding site opposite the Cy3 fluorophore. We used 167-bp DNA for this assay. (H) Cy3 images of the EMSA of the 147-bp nucleosomes containing the Cbf1-binding site at P8 used for ensemble FRET experiments. (I) Cy3 images of the EMSA of the 222-bp nucleosomes containing the Cbf1-binding site at P8 used for smFRET experiments.
Figure 1—figure supplement 2. The Reb1–nucleosome bound complex in EMSAs.

Figure 1—figure supplement 2.

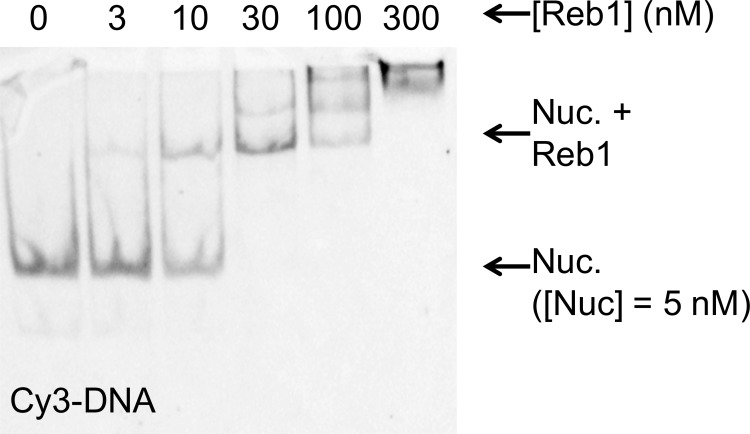
Cy3 images of the EMSA of Reb1 binding to nucleosomes containing Cy5-H2A(K119C). This demonstrates that the Reb1 shifted complex contains Cy3-DNA. This, combined with Figure 1C, demonstrates that the Reb1 binds a stable nucleosome complex.
Figure 1—figure supplement 3. Reb1 nucleosome EMSAs.

Figure 1—figure supplement 3.

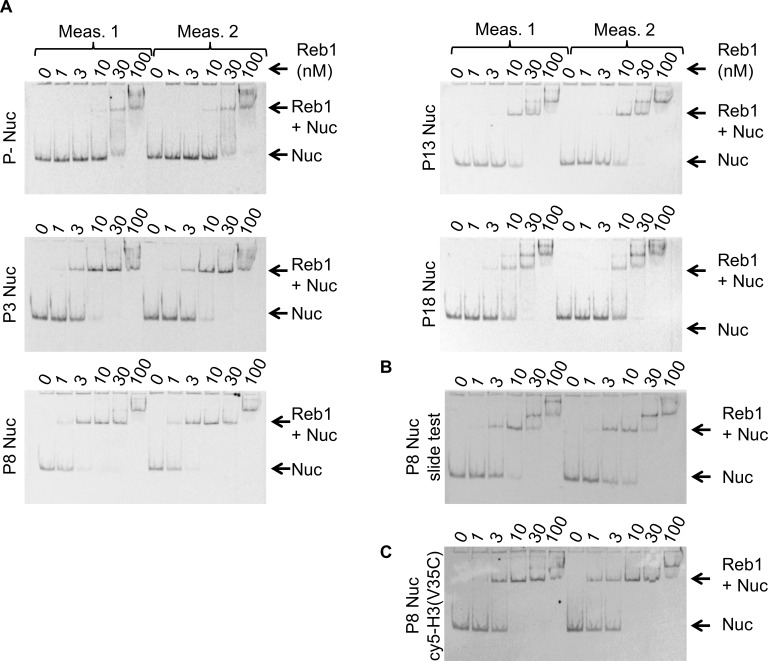
(A) Cy5 images of Reb1–nucleosome EMSAs. We define position of the binding site in the 601 sequence as'Px’ where ‘x’ represents the beginning of the Reb1-binding site. P– are nucleosomes without the Reb1-binding site. All EMSA measurements were performed in duplicate. (B) Cy5 image of the Reb1–nucleosome EMSA used to test for Reb1-induced nucleosome repositioning, referred to as ‘Reb1-slide.’ (C) Cy5 image of the Reb1–nucleosome EMSA using nucleosomes Cy5 labeled at H3(V35C).
Figure 1—figure supplement 4. Reb1–nucleosome EMSA fits.

Figure 1—figure supplement 4.

Binding curves generated from data in Figure 1—figure supplement 3. (A) Binding curves for P3, P8, P13, P18, and P– Reb1-nucleosome EMSAs. (B) Binding curves for the Reb1-slide nucleosome EMSA. (C) Binding curve for the Reb1–Cy5-H3(V35C) nucleosome EMSA.
Figure 1—figure supplement 5. Reb1–DNA EMSAs.

Figure 1—figure supplement 5.

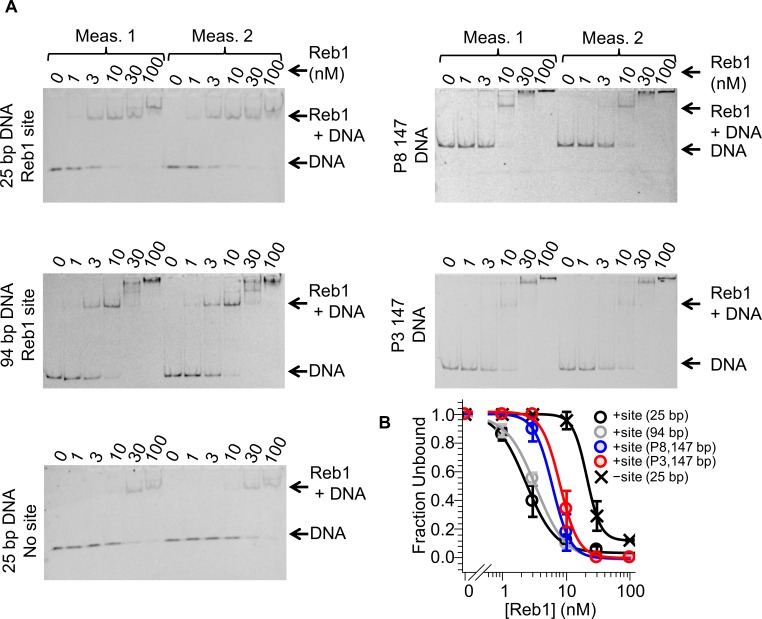
Cy3 images of EMSAs used to quantify Reb1 binding to DNA constructs with and without the Reb1-binding site. (A) 25-bp DNA and 94-bp DNA used for smPIFE experiments, as well as 25-bp DNA without the Reb1 binding site, P8 147-bp DNA and P3 147-bp DNA. (B) Binding curves fit to these data.
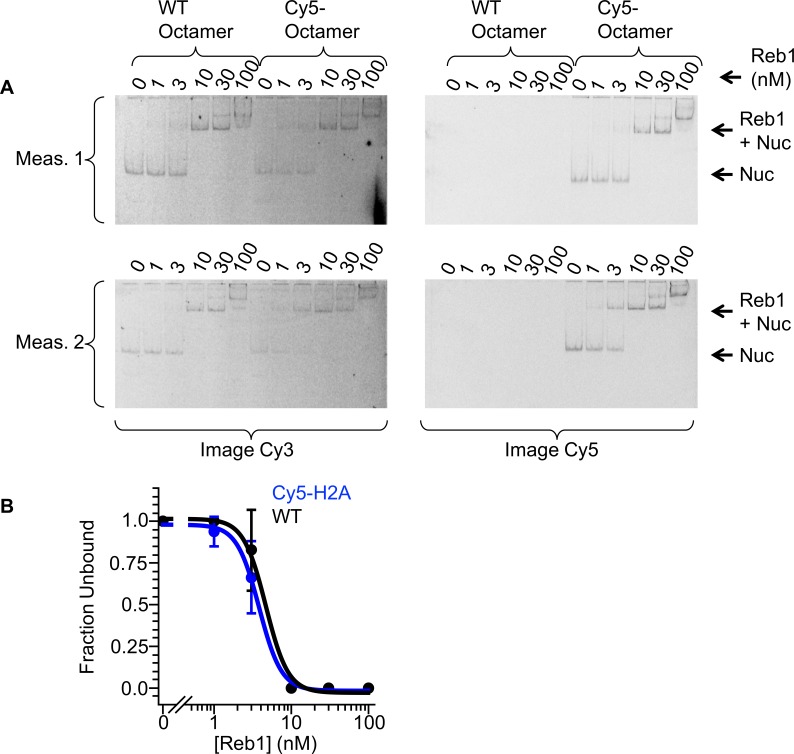
Figure 1—figure supplement 6. Comparison of Reb1-binding affinities to labeled and unlabeled octamers.

Figure 1—figure supplement 6.

(A) Cy3 and Cy5 images of Reb1 binding to nucleosomes reconstituted with a WT octamer or with a Cy5-octamer, visualized with EMSAs. (B) Binding curves that are fitted to these data reveal similar affinity to these two nucleosomes (S1/2 Reb1–Nuc unlabeled Octamer = 4.7 ± 0.5 nM, S1/2 Reb1–Nuc Cy5 octamer = 3.8 ± 0.2 nM).