. 2019 Mar 19;8:e43008. doi: 10.7554/eLife.43008

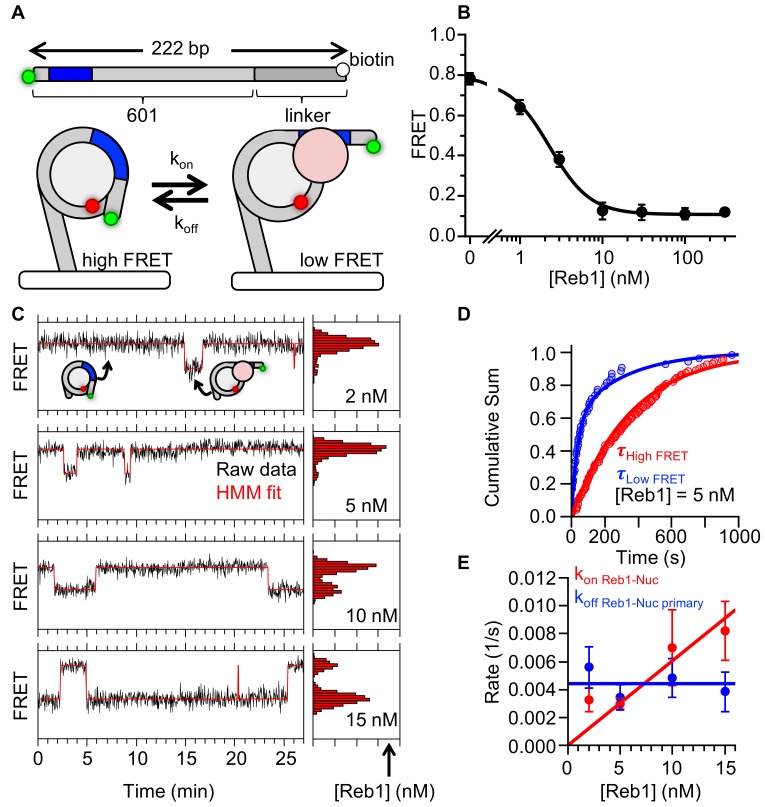
Figure 4. Reb1 binds and dissociates from nucleosomes significantly slower than DNA.

(A) smFRET P8 nucleosomes are tethered to the microscope surface through an additional 75 bp of DNA extending out of the nucleosome opposite to Cy3 and the Reb1-binding site. The octamer was labeled with Cy5 at H2A(K119C). Reb1 binding traps the nucleosome in a low FRET state. (B) Ensemble FRET titration of Reb1 with smFRET nucleosomes. The titration fits to a binding isotherm with an S1/2 Reb1–smNuc P8 FRET = 2.2 ± 0.2. This value is similar to that for titrations with nucleosomes containing 147-bp DNA (Figure 2B). (C) Example time traces of single nucleosomes at four separate Reb1 concentrations, which are fitted with a two-state Hidden-Markov Model. As the Reb1 concentration increases, the immobilized nucleosome shifts to the low FRET state. (D) Cumulative sums of dwell times in the high FRET (red) and low FRET states (blue), which fit to single and double exponentials, respectively. The Reb1 concentration is 5 nM. (E) The primary Reb1-binding (red) and -dissociation (blue) rates for increasing Reb1 concentrations. The dissociation rates are constant with an average rate of koff Reb1–Nuc primary = 0.0044 ± 0.0005 s−1, whereas the binding rates fit to a line with a slope that equals the overall binding rate of kon Reb1–Nuc primary = 0.0006 ± 0.0001 s−1 nM−1.

Figure 4.

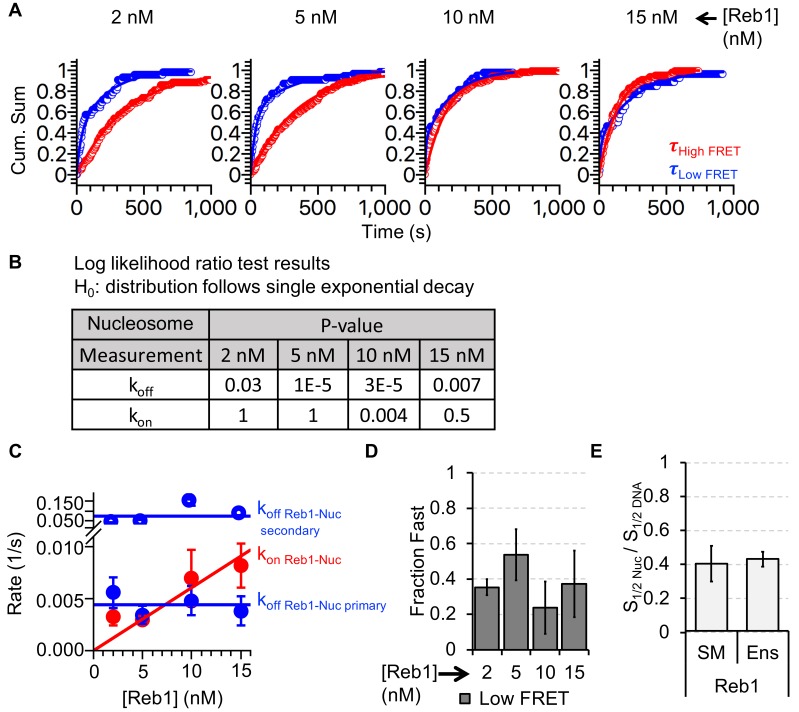
Figure 4—figure supplement 1. Analysis of Reb1–nucleosome single-molecule binding experiments.

Figure 4—figure supplement 1.

(A) Cumulative sums of high FRET (red) and low FRET (blue) dwell times for nucleosomes at each Reb1 concentration. (B) Table of the log-likelihood ratio used to test the assumption that a cumulative sum fits to a double exponential. If the result is more than 0.01 for three of the Reb1 concentrations, we reject the assumption and fit with a single exponential. For Reb1–Nnucleosome interactions, the low FRET cumulative sums follow double exponentials. (C) Plots of the rates of Reb1 binding (red) to nucleosomes, and both the primary and secondary rates for the dissociation of Reb1 (blue) from nucleosomes for four concentrations of Reb1. These are determined from the exponential fits of the cumulative sums in panel (A). (D) The fraction of the fast dissociation rates of Reb1 from nucleosomes for increasing Reb1 concentrations. For Reb1 dissociation from nucleosomes, the slower rate accounted for ~60% of all of the dissociation events. (E) Ratio of the nucleosome-binding affinity to DNA-binding affinity for Reb1 for both single-molecule (SM) and ensemble (Ens) measurements. The ratio obtained using the dominant rates from single-molecule measurements is consistent with the ratio from ensemble measurements.