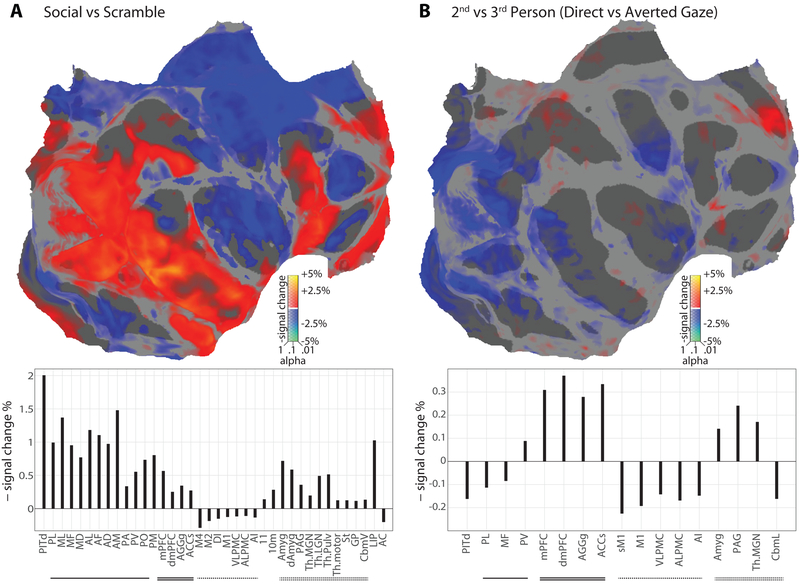
Figure 2: Neural Responses to Social Stimuli and to Interactive Contexts.
(A, top) Digitally flattened map of monkey cortex, in which the occipital pole is toward the left (cut along the calcarine), the temporal pole is at bottom right, the anterior pole is to the right, and the medial wall is in the upper right (cut across the mid-cingulate and posterior to the ascending limb). Areas with increased/decreased activity during social video versus scrambled video are shown in hot/cool colors respectively, scaled according to percent signal change; significance (corrected for multiple comparisons by estimating the false discovery rate) is indicated by opacity. Note that in IRON-fMRI, negative signal change corresponds to increased activity. Significantly modulated ROI are labeled. (A, bottom) Bar graph of significant ROI responses to social versus scrambled video, including both cortical and subcortical regions. Upward bars indicate decreased signal, and hence increased blood flow and brain activity. Activity changes were calculated by weighted least squares estimation across all subjects and brain hemispheres (20 hemispheres total); significance was not corrected for multiple comparisons. Face patches are underline, medial decision-associated are doubly underlined, facial motor regions are dash-lined, and subcortical regions are double dash-lined. Key regions activated by social stimuli include form-selective visual cortex, the temporal and frontal face patch systems, and medial frontal regions. (B, top) Flatmap of increased/decreased activity during 2nd person social video (direct gaze) versus 3rd person social video (averted gaze). Significantly affected ROI are labeled. (B, bottom) Bar graph of significant ROI responses to 2nd-person versus 3rd-person video perspectives. Key regions activated by 2nd person context were largely restricted to medial frontal cortex near the caudalmost anterior cingulate.

