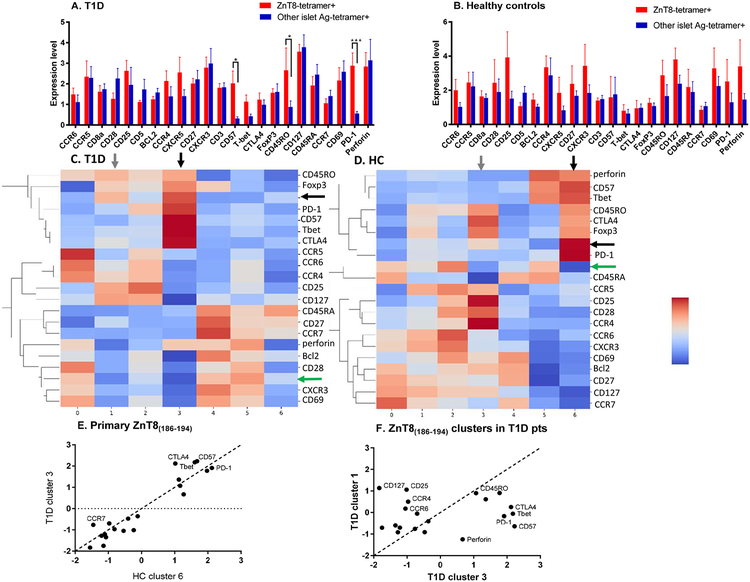
Figure 4. CyTOF analysis of antigen specific T cells:
(A and B) Using bar-coded tetramers, we analyzed the expression of the indicated markers on CD8+ T cells that were specific for ZnT8186–194 (red) or specific for CD8+ T cells reactive with the 5 other islet antigen peptides that were pooled (IGRP228–236, PPI2–10, PPI34–42, PPI15–24, IA-2797–805)(blue). The results of 6 healthy controls and 6 patients with T1D from 2 independent experiments are shown. Values were normalized with the signal intensity of reference cells that were added to all of the assays and the intensity of the signals were compared between the ZnT8 tetramer+ and other tetramer+ cells using two-way ANOVA for paired comparisons with post-hoc analysis of the individual markers (mean±SEM). The expression of CD45RO (*p<0.05), CD57 (*p<0.05), and PD-1 (***p<0.001) were increased in the ZnT8-tetramer+ cells from patients with T1D. (C, D) The CyTOF data were analyzed by SAUCIE to identify clusters among the tetramer+ cells and their associated markers. In patients with T1D and HC subjects the ZnT8186–194–reactive cells were found most commonly in clusters 3 and 6 respectively (black horizontal and vertical arrows), but some cells were also found in clusters 1 and 3 respectively (black horizontal and gray vertical arrows). The T cells reactive to other diabetes antigens were distributed in 3 clusters (clusters 0, 4, 5 in the T1D patients and clusters 0, 2, 5 in the HC subjects, green arrows). (E, F) The average values of markers within the dominant clusters of the ZnT8186–194–reactive cells in the T1D patients (cluster 3) and HC subjects (cluster 6). The dotted line is the line of identity. In F the differences between the two clusters of ZnT8186–194–reactive cells are shown.

