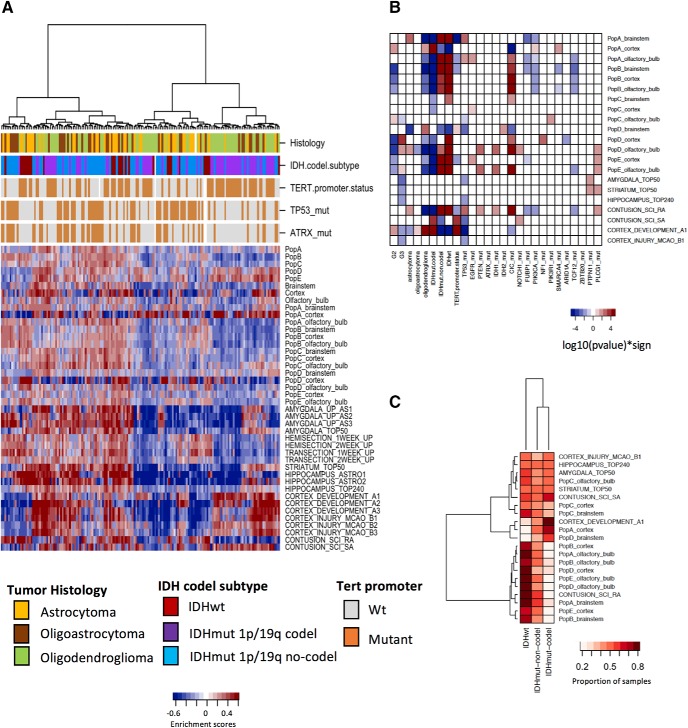
Figure 4.
Correlation between upregulated astrocyte gene signatures and TCGA LGG samples. A, Heatmap displaying the hierarchical clustering of enrichment scores obtained through GSVA. High scores indicate strong positive correlation between astrocyte gene signatures and 160 TCGA LGG samples with tumor purity >70%. Top bars indicate tumor histology and known co-occurring genomic alterations: IDH mutation combined with 1p/19q codeletion subtype (IDH.codel.subtype), mutations in TERT promoter (TERT.promoter.status), TP53 mutations, and ATRX mutations. B, Exploratory analysis of the correlation between astrocyte gene signatures (y-axis) and LGG grades, histologic subtypes, somatic mutations, and copy-number variations (x-axis). The heatmap depicts the -log10-transformed p value of either an ANOVA comparison between LGG subtypes or a Wilcoxon rank sum test between samples carrying the selected mutations, amplifications, and deletions. C, Heatmap depicting the proportion of LGG samples with specific IDH status variants that had positive enrichment scores for every astrocyte gene signature. For viewing clarity, only 21 representative astrocyte gene signatures are shown in each B and C. Displays depicting complete astrocyte gene signatures are available in Extended data Figure 4-1. See also Extended data Figures 3-1, 3-2, 3-6, 4-1, 4-2, and 4-3.

