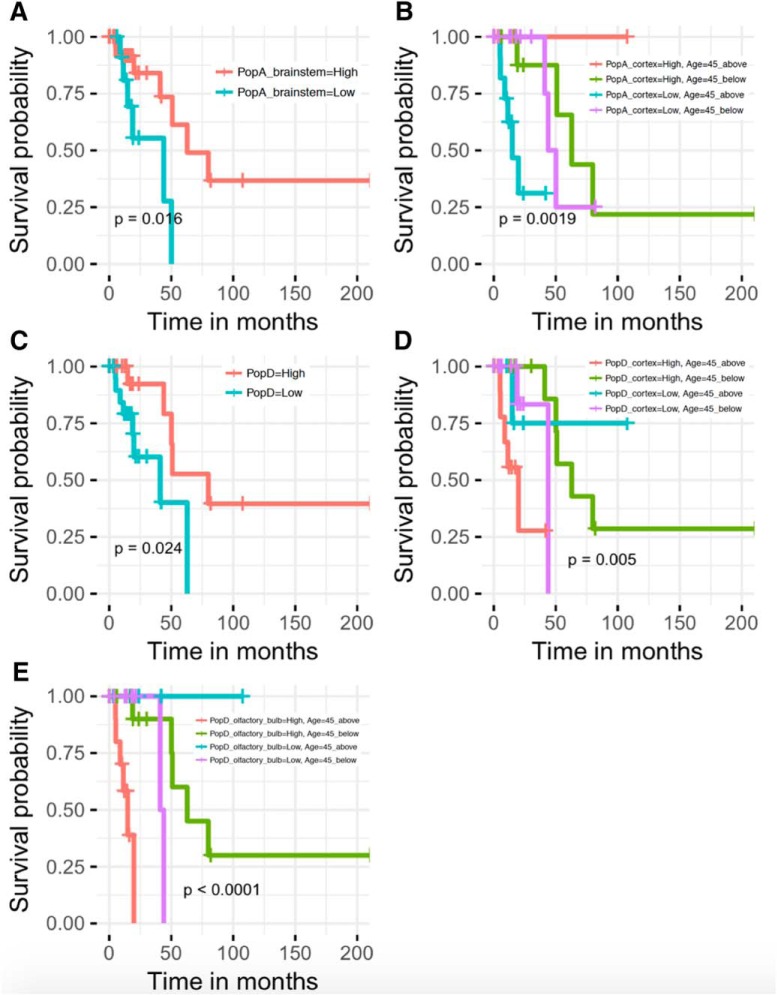
Figure 5.
Astrocyte subpopulation gene signatures are associated with survival time differences in TCGA LGG astrocytoma patients. Figure shows Kaplan–Meier plots and log-rank test p values of sample groups stratified according to High and Low enrichment scores for (A) brainstem subpopulation A, (B) cortex subpopulation A and age, (C) subpopulation D, (D) cortex subpopulation D and age, and (E) olfactory bulb subpopulation D and age.

