Figure 4.
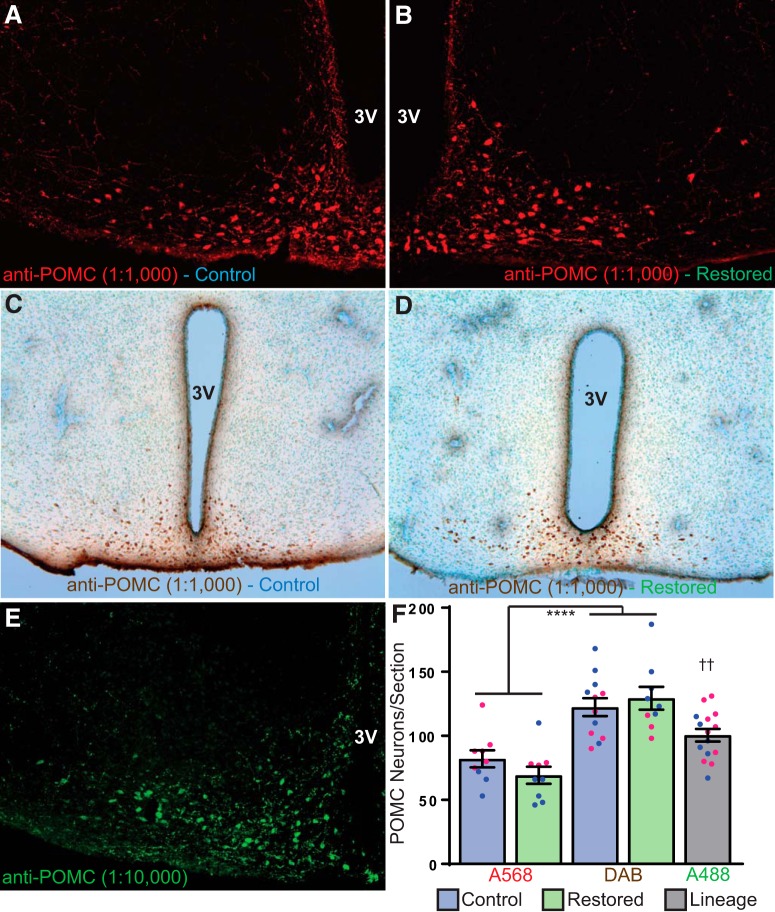
IHC for POMC cell counts in control and restored mice, and from VGlut2-Cre; tdTomato animals. A, POMC-IR in a male control mouse detected with an Alexa Fluor 568 (red) secondary antibody (1:500). B, POMC-IR in a male restored mouse detected with an Alexa Fluor 568 (red) secondary antibody (1:500). C, POMC-IR in a female control mouse detected with biotinylated secondary antibody (1:500) and visualized with a diaminobenzidine (DAB) reaction (brown). D, POMC-IR in a female restored mouse detected with biotinylated secondary antibody (1:500) and visualized with a DAB reaction (brown). E, POMC-IR in a female Vglut2-Cre; tdTomato mouse detected with an Alexa Fluor 488 (green) secondary antibody (1:500; mirrored section from Fig. 1G,H). F, POMC neuron cell counts from sections (three per mouse). There was no difference between control (blue bars) or restored (green bars) mice, but only in the method of secondary labeling used. Male data for each group represented by filled blue circles and female data shown by filled pink circles; ****p < 1e-7, denotes the difference between all A568 counts compared to all DAB counts, ††p < 0.01, denotes the difference between all A488 counts compared to all A568 and DAB cell counts. 3V, third ventricle.

