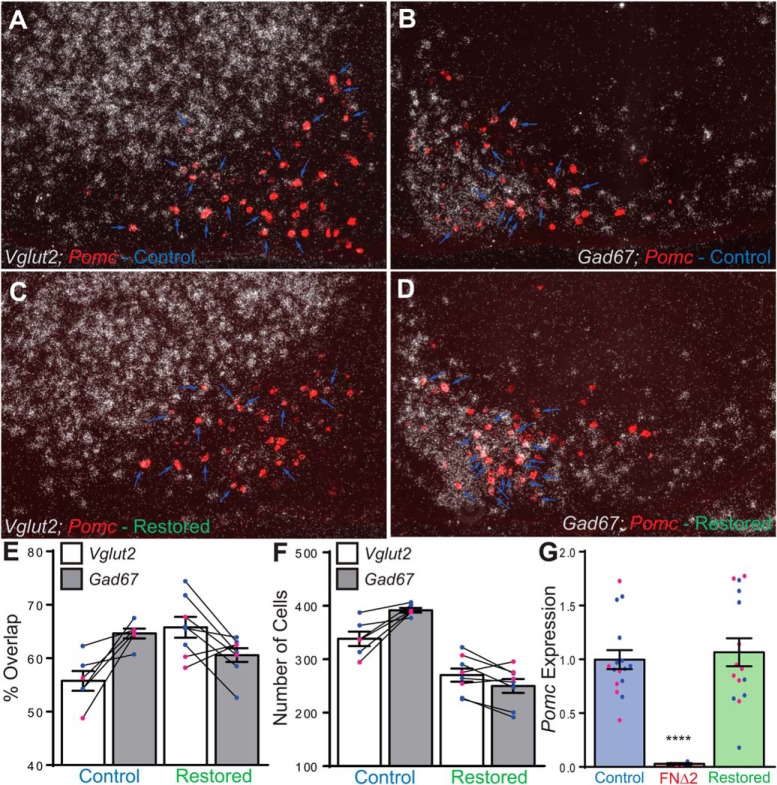
Figure 5.
Dual-label ISH for Pomc and Vglut2 or Gad67, and relative Pomc expression in the medial basal hypothalamus of control and restored mice. A, ISH for Vglut2 (silver grains) and Pomc (red) in a female control mouse. Note that the green fluorescence of Alexa Fluor 488 used to detect Pomc was pseudocolored to red for these images. B, ISH for Gad67 (silver grains) and Pomc (red) in a female control mouse. C, ISH for Vglut2 (silver grains) and Pomc (red) in a female restored mouse. D, ISH for Gad67 (silver grains) and Pomc (red) in a female restored mouse. In panels A–D, blue arrows indicate overlap between Pomc and the silver grain (Vglut2 or Gad67) signal. E, Degree of overlap between Pomc and Vglut2 (white bars) or Gad67 (grey bars) in control and restored mice, each animal’s Vlgut2/Pomc and Gad67/Pomc overlap percentage is connected by the solid black lines. F, Cell count of overlap between Pomc and Vglut2 (white bars) or Gad67 (grey bars) in control and restored mice, each animal’s Vlgut2/Pomc and Gad67/Pomc overlap count is connected by the solid black lines. G, Relative qRT-PCR of Pomc expression in the medial-basal hypothalamus of control (blue bar, left), FNΔ2 (red bar, middle), and restored (green bar, right) mice. Male data are represented by filled blue circles and female data by filled pink circles.

