Figure 6.
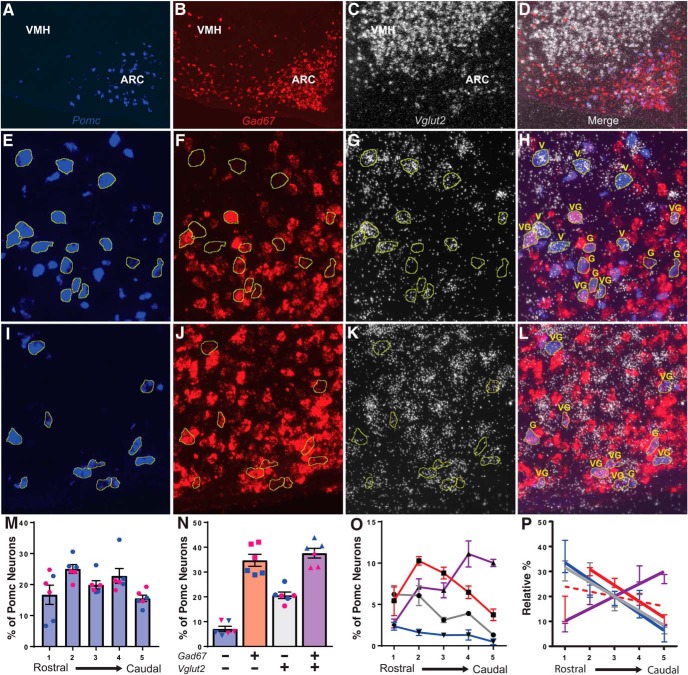
Triple-label ISH for Pomc (A, E, I), Gad67 (B, F, J), Vglut2 (C,G,K), and overlaid signals (D, H, L) in WT mice throughout the rostral-caudal ARC axis. A–D, Low-magnification image of ISH signal for Pomc, Gad67, Vglut2, and the overlay of all signals from a male mouse. Note that the green fluorescence of Alexa Fluor 488 used to detect Pomc was pseudocolored to blue for these images. E–H, 40× images from the rostral ARC from a male mouse with Pomc neuron profiles outlined in yellow. I–L, 40× images from the caudal ARC from a female mouse with Pomc neuron profiles outlined in yellow. V indicates Vglut2 + Pomc neurons, G indicates Gad67 + Pomc neurons, and VG indicates Vglut2/Gad67 + Pomc neurons. M, The distribution of Pomc neurons along the rostral-caudal ARC axis. N, The overall percentages of Pomc-only (blue bar with filled inverted triangles), Gad67 + (red bar with filled squares), Vglut2 + (grey bar with filled circles), and Vglut2/Gad67 + (purple bar with filled triangles) Pomc neurons in the arcuate nucleus. Male data are represented by filled blue symbols and female data by filled pink symbols. O, The percentages of Pomc-only (blue line with filled inverted triangles), Gad67 + (red line with filled squares), Vglut2 + (grey line with filled circles), and Vglut2/Gad67 + (purple line with filled triangles) Pomc neurons at each coronal level 1 to 5 along the rostral-caudal ARC axis. P, Linear regression analysis of the relative percentage of each phenotypic category of Pomc neurons along the rostral-caudal ARC axis [Pomc-only solid blue line, Gad67 + dotted red line, Gad67 + (levels 2–5) solid red line, Vglut2 + solid grey line, Vglut2/Gad67 + solid purple line].

