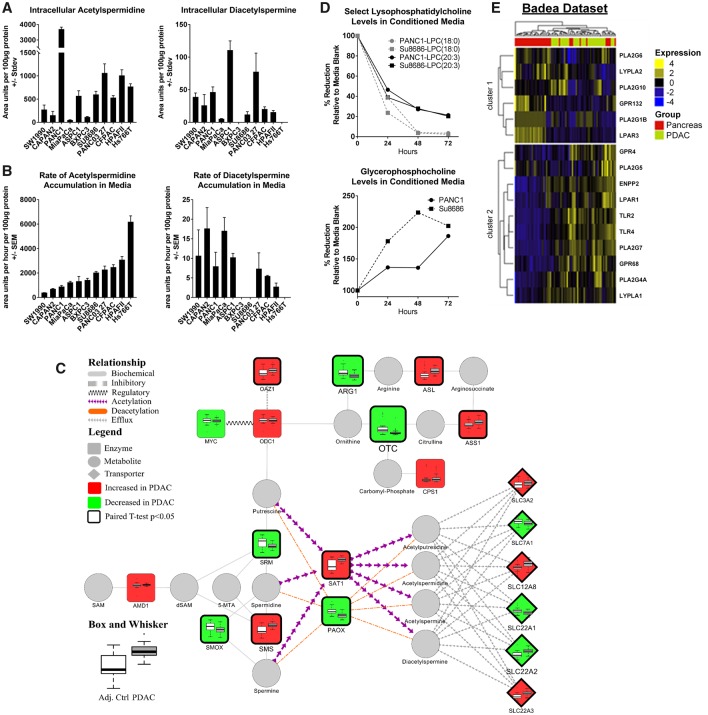
Figure 5.
Polyamine and lipid metabolism in PDAC. A) Abundances (area units +/- SD) of N1/N8-acetylspermidine or diacetylspermine in cell lysates of 11 PDAC cell lines. B) Abundance (area units +/- SD) of N1/N8-acetylspermidine or diacetylspermine in serum-free media collected one, two, four, and six hours post conditioning from 11 PDAC cell lines. C) Network displaying enzymes involved in the biosynthesis of polyamines and their acetylated derivatives. Node color (light gray = decreased; dark gray = increased) and size depict the direction and magnitude of change in mRNA expression of respective enzymes between PDAC and adjacent control tissue. Thickened node border illustrates statistical significance (two-sided paired t test P < .05). Box and whisker plots illustrate the distribution of mRNA expression for the respective enzyme between PDAC and adjacent control tissue. mRNA expression data were obtained from Oncomine (15) and are based on the Badea data set (14). D) Percent change in serum-containing media composition of lysophosphatidylcholine(18:0), lysophosphatidylcholine(20:3), and glycerophosphocholine in PANC1 and SU8686 PDAC cell lines following 24, 48, and 72 hours of culturing. E) Heat map depicting mRNA expression of enzymes and surface receptors known to directly participate in the metabolism or binding of lysophosphatidylcholines between PDAC and adjacent control tissue. Data were obtained from Oncomine (15) and are based on the Badea data set (14). Unsupervised clustering was performed using Euclidean distance with Ward’s method.

