
Figure 3 –
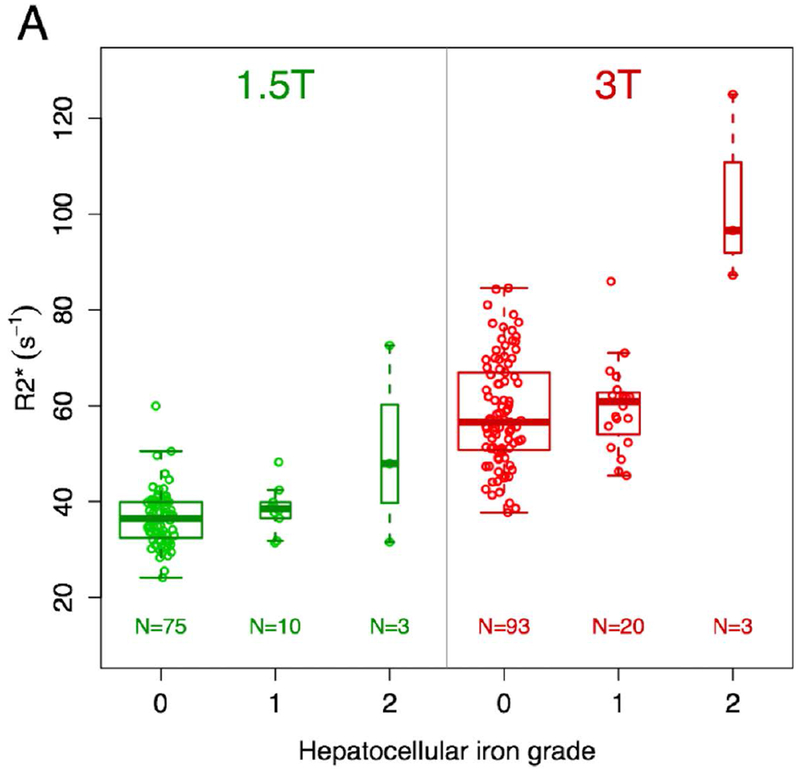
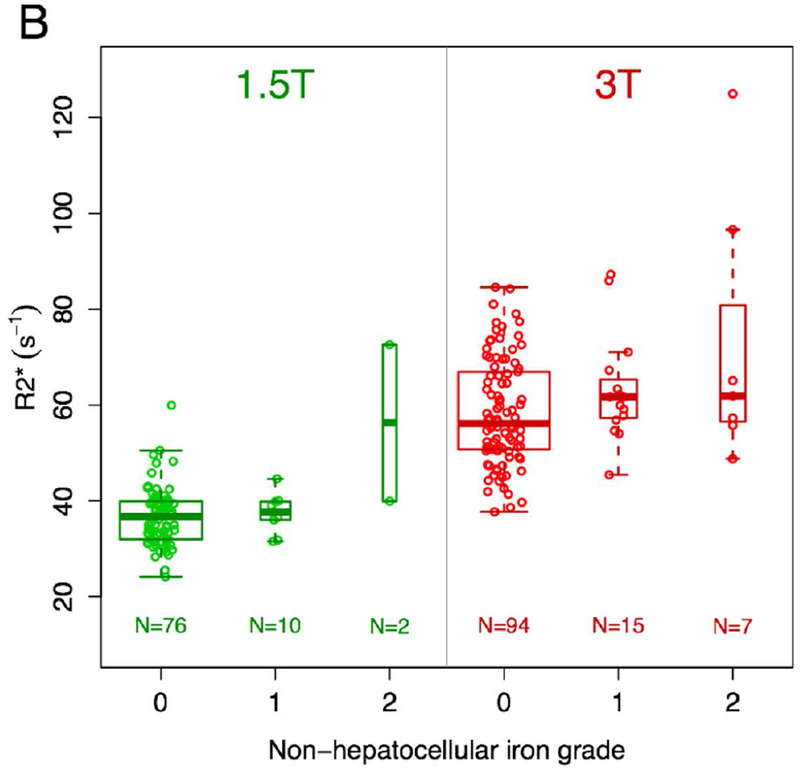
Box and whisker plots of R2* values based on type and grade of iron deposition and magnetic field strength. There are visual trends toward higher R2* values for grade 2 iron deposition compared with grades 0 and 1 for hepatocellular iron (a) at both field strengths and non-hepatocellular iron (b) at 1.5T, though with very small samples sizes for grade 2 (n=2-3). For the largest group with grade 2 iron deposition (non-hepatocellular iron imaged at 3T, n=7), the median R2* value is similar to the median R2* values for grades 0 and 1 iron deposition.