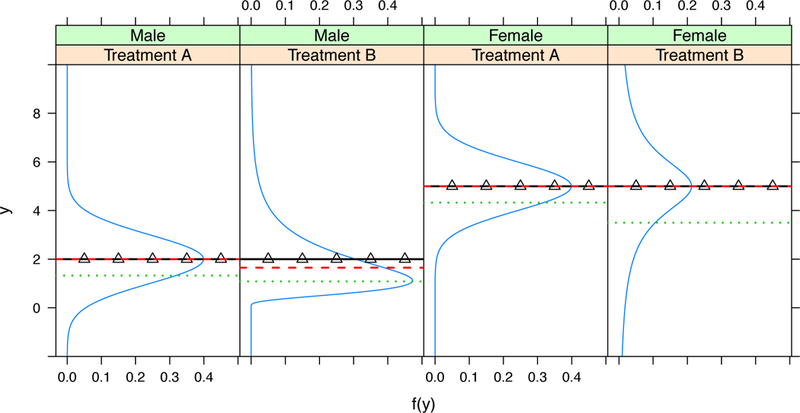
FIGURE 1.

The distribution functions of the response Y, in a randomized clinical trial with two treatments, A and B, for male (two panels on the left) and female (two panels on the right). The solid lines with triangle symbol, dashed line, and dotted lines are the conditional mean, 50% quantile, and 25% quantile functions of Y given the gender and the treatment, respectively.
