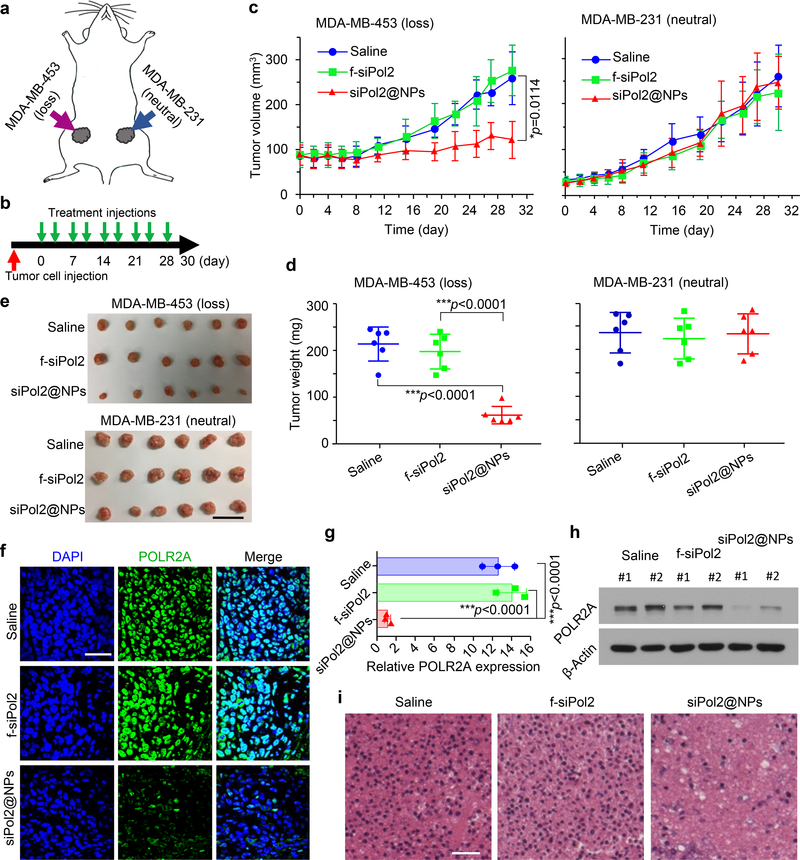
Fig. 6. Targeted POLR2A inhibition selectively suppresses the growth of wild type cells derived POLR2Aloss tumours.
a, A schematic illustration of the tumours established by implanting MDA-MB-453 (TP53mut, POLR2Aloss) cells on the left and MDA-MB-231 (TP53mut, POLR2Aneutral) cells on the right 4th inguinal mammary fat pads. b, An illustration of the treatment intervals. The mice were injected with the various treatments twice a week. c-e, Growth curves (c), weight (d), and gross images (e) of tumours derived from POLR2Aloss and POLR2Aneutral human TNBC cells with various treatments. The data indicate that tumours with POLR2Aloss are highly sensitive and vulnerable to further POLR2A inhibition. Error bars denote mean ± s.d. In c, the p values for comparisons of siPol2@NPs versus Saline and siPol2@NPs versus f-siPol2 are 0.0114 (indicated in c) and 0.0061, respectively. The statistical significance was assessed by one-way ANOVA with a Fisher’s LSD post hoc test for c or Dunnett’s post hoc test for d. The biologically independent sample size n=6. Scale bar: 2 cm. f-g, Immunofluorescence staining (f) of POLR2Aloss tumours and quantitative data of POLR2A expression (g) in tumours with various treatments (n=3 independent experiments with 3 replicates in each experiment). The statistical significance was assessed by one-way ANOVA with a Dunnett’s post hoc test. h-i, Protein level of POLR2A (h) and H&E staining (i) of the aforementioned POLR2Aloss tumours. The experiments were repeated three times independently. In h, two representative samples for each treatment are shown. Scale bar: 50 μm. Error bars denote mean ± s.d.; *: p < 0.05; and ***, p < 0.001.

