
Fig. 10:
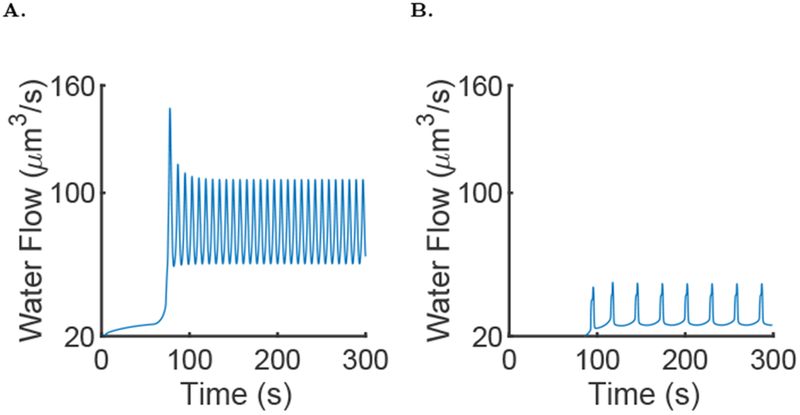
Results of simulation of the full model, with μ = 0 for the first 60 seconds then followed by μ = 0.007 and the parameters given in the supporting material A: Fluid flow in the full model during a typical simulation of the model. It is the same simulation as in Fig. 9. B: Fluid flow in the full model during a typical simulation with the active propagation knocked out.