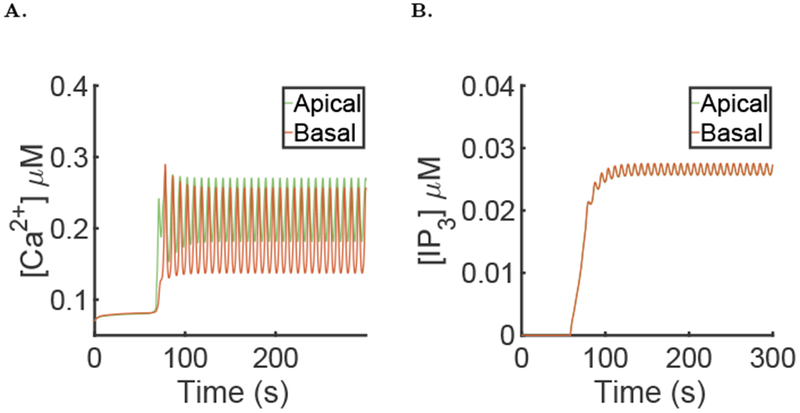
Fig. 16:

Results of the simulation on another cell, using the same parameters as in Fig. 9 A: Spatial mean [Ca2+] time series in the apical and basal region during a simulation of the model. B: Spatial mean [IP3] time series in the apical and basal region during a simulation of the model.
