
Fig. 3:
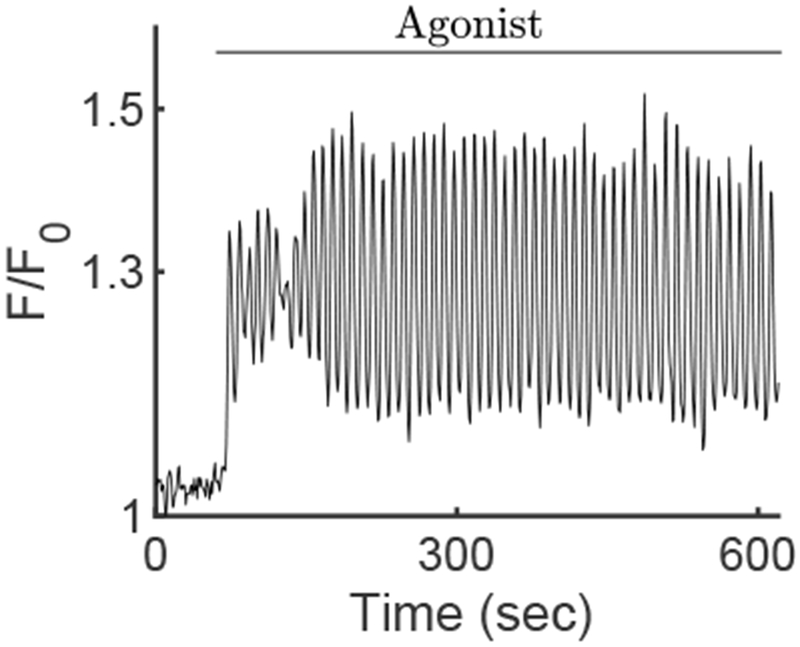
Time series of the mean fluorescence of the Ca2+ indicator Fluo-4, averaged over the whole cell. Ca2+ oscillations appear after the exposure of the cell to Carbachol. These data have been extracted from a movie given in the supplementary material.