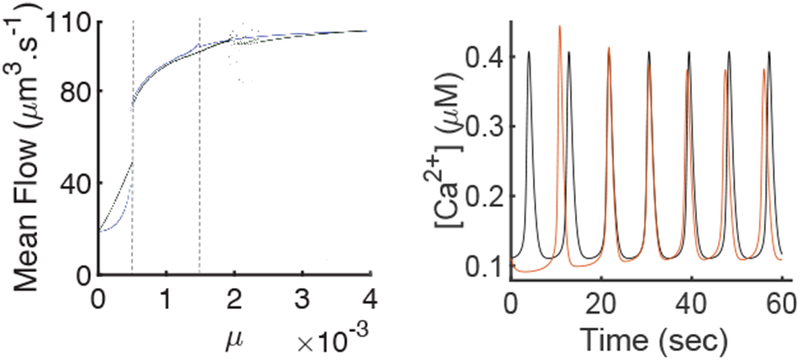
Fig. 8:

A: Comparison of the average fluid flow between the closed-cell model, in blue, (Eq. 22) and the open cell model, in black, (Eq. 23). To get each point of this graph we integrated the system numerically to get either a periodic orbit or an equilibria. In the case of a periodic orbit we computed the average fluid flow during one period and in the case of the equilibria we computed the constant fluid flow. The region between the two dashed lines is the region where both models have stable periodic orbits. The cloud of points in the right part of the open-cell model is due to periods of the solutions getting too long which induces errors in the estimations of the average fluid flow. B: Time series of [Ca2+] in the closed-cell model, in black, (Eq. 22) and the [Ca2+] in the open-cell model, in red, (Eq. 23) for μ = 0.0013. Both models are integrated from the same initial condition. We can see that the transient is different in the open-cell model, but the stable periodic orbits are similar.
