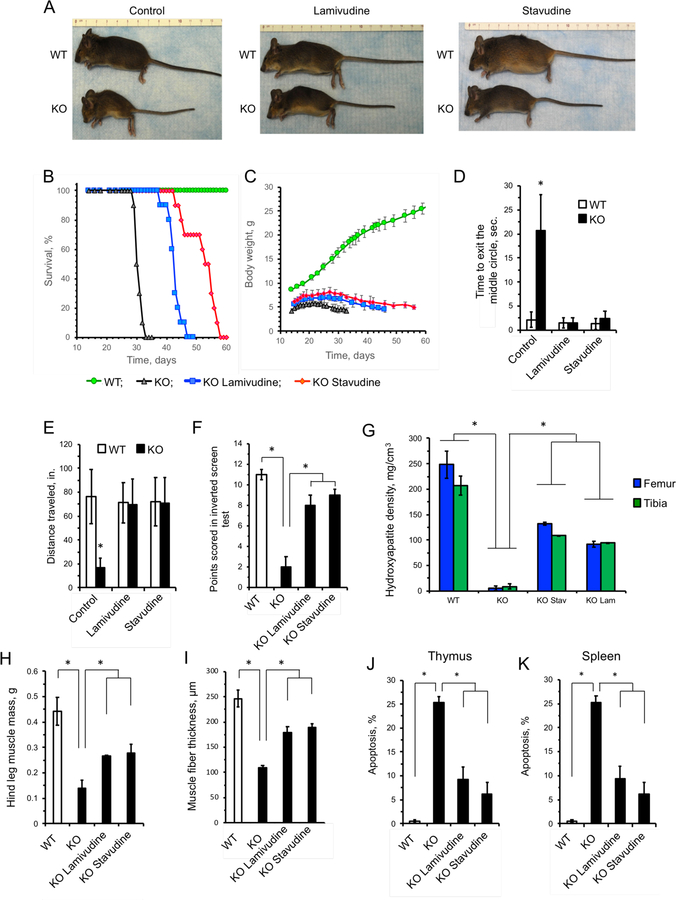
Figure 5 |. Treatment with NRTIs extends lifespan and improves health of SIRT6 KO mice.
A, NRTI treatment improves the appearance and alleviates wasting phenotype of SIRT6 KO animals. Pictures were taken at 30 days of age.
B, NRTI treatment extends mean and maximum lifespans of SIRT6 KO mice. The survival curves for SIRT6 KO NRTI-treated mice were significantly different from untreated SIRT6 KO controls. n=10 animals, p < 0.0001, log-rank test.
C, NRTI treatment improved body weight of SIRT6 KO animals. n=10 animals. p < 0.0001, One Way ANOVA.
D-F, NRTI treatment rescues physical impairments in SIRT6 KO mice. D, Open field test: healthy mice avoid unfamiliar open spaces and rapidly run to the corners when placed in the center. Time to exit the field was measured. E, Foraging activity. F, Inverted screen test measures the time a mouse holds on to an inverted mesh screen. For each animal the point score was calculated as a sum of the scores for three trials, then an average was calculated for six animals. n=6 animals per group, and three replicate tests were performed for each animal.
G, Bone density of SIRT6 KO animals is significantly reduced, and is partially rescued by NRTI treatment. Data were determined by CT-scan and analysis of 27-day old animals. n=3 animals per group and error bars show s.d. Representative images of the bones are shown in Figure S4D.
H, I, Hind leg muscle mass (H) and fiber thickness (I) are significantly reduced in SIRT6 KO animals and are partially rescued by NRTI treatment. Hind quarters (feet, tibia, femur were separated at pelvis, including all muscle groups, with exception of gluteus maximus) were removed and weighed. Fiber thickness was measured in quadriceps muscles fixed and stained with hematoxylin & eosin. At least 50 fibers were measured for cross sectional diameter per group at similar lateral locations on the quadriceps. n=3 animals per group, error bars show s.d. Representative images of the muscles are shown in Figure S4E.
J, K, NRTIs attenuate apoptosis in the thymus (J) and spleen (K) of SIRT6 KO mice. Apoptosis was measured in single cell suspensions by annexin V/PI staining and flow cytometry. n=5 animals per group, error bars show s.d. asterisks indicate p < 0.01.
Unless stated otherwise, statistical significance was determined by the Student’s t-test and asterisks indicate p < 60.05.

