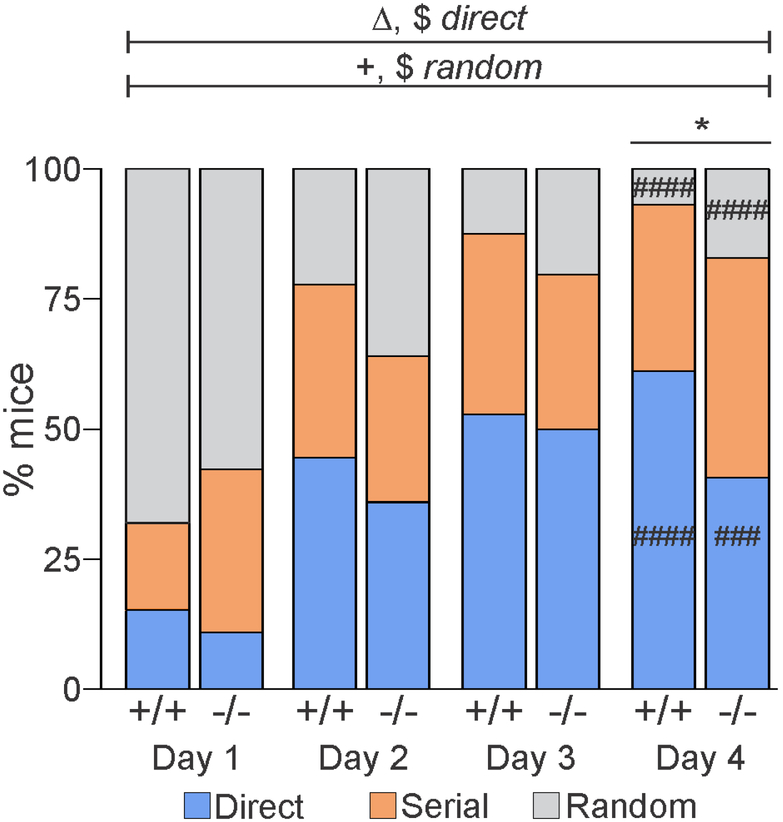
Figure 3: DBI−/− mice show curtailed adoption of direct search strategy by day 4.
Percentage of DBI+/+ and DBI−/− mice using each search strategy (direct: blue bars; serial: orange bars; random: gray bars) over the course of 4 days (each day represents the average of 4 trials). □□ significant effect of genotype (P < 0.05); $, significant effect of day (P < 0.0001); +, significant day-bygenotype interaction (P < 0.05) for the indicated search strategies; *, significant difference in use of direct search strategy between DBI+/+ and DBI−/− mice on day 4 (P < 0.05); ###, ####, significant difference comparing days 1 and 4 for each search strategy within genotype (P < 0.001, P < 0.0001, respectively)

