
Figure 1. α-diversity in normal lung tissue and survival.
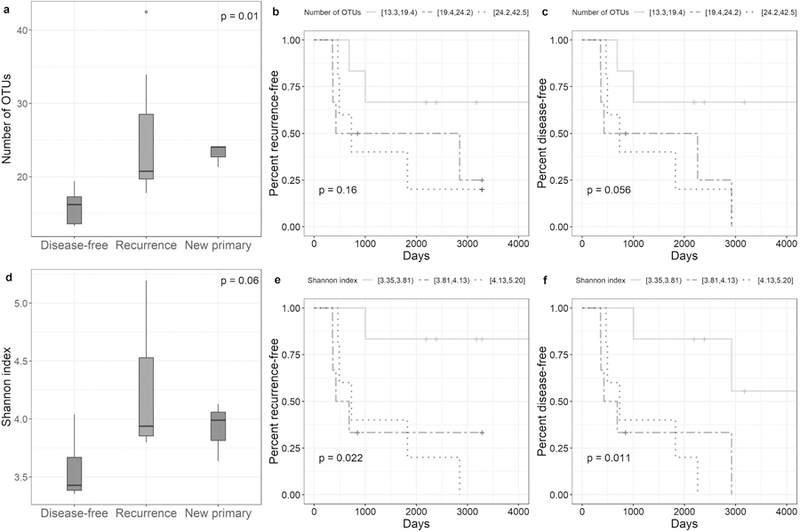
(a) Distribution of number of OTUs at an even depth of 63 sequence reads per sample in normal lung tissue by recurrence status of patients (p-values are from Kruskal-Wallis tests). (b-c) Recurrence-free and disease-free survival curves for patients grouped in tertiles of number of OTUs at an even depth of 63 sequence reads per sample in normal lung tissue (p-values are from log-rank tests for trend). (d) Distribution of the Shannon index at an even depth of 63 sequence reads per sample in normal lung tissue by recurrence status of patients (p-values are from Kruskal-Wallis tests). (e-f) Recurrence-free and disease-free survival curves for patients grouped in tertiles of the Shannon index at an even depth of 63 sequence reads per sample in normal lung tissue (p-values are from log-rank tests for trend).