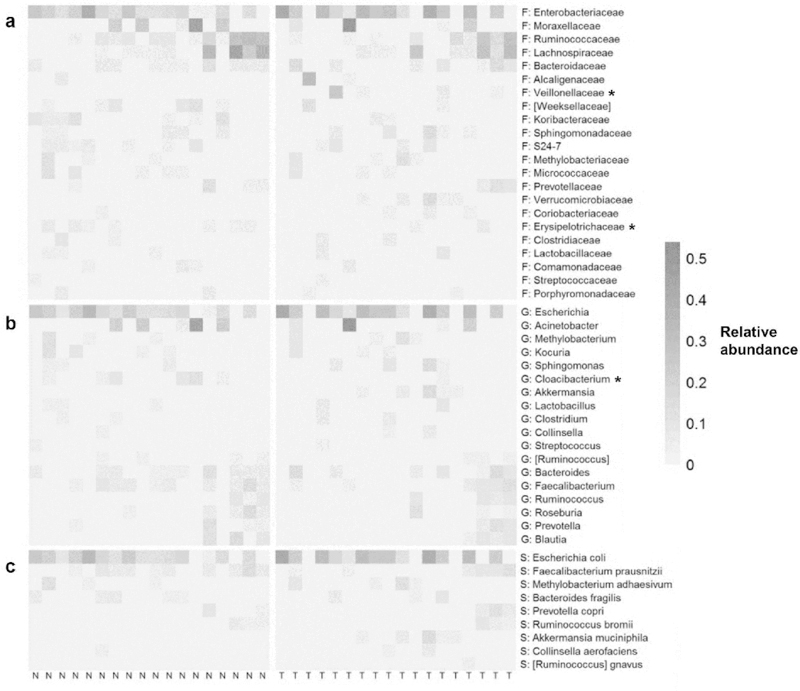
Figure 5. Taxa associated with lung tissue type (tumor vs. normal).

Heatmap shows relative abundance of (a) families, (b) genera, and (c) species in paired normal (N) and tumor (T) samples (only taxa present in >25% of samples are shown). Normal and tumor samples are sorted left to right by patient ID. Taxa with * indicate p<0.05 from Wilcoxon signed-rank test for pair difference in relative abundance, or McNemar’s test for pair difference in carriage (Supplementary Table 6).
