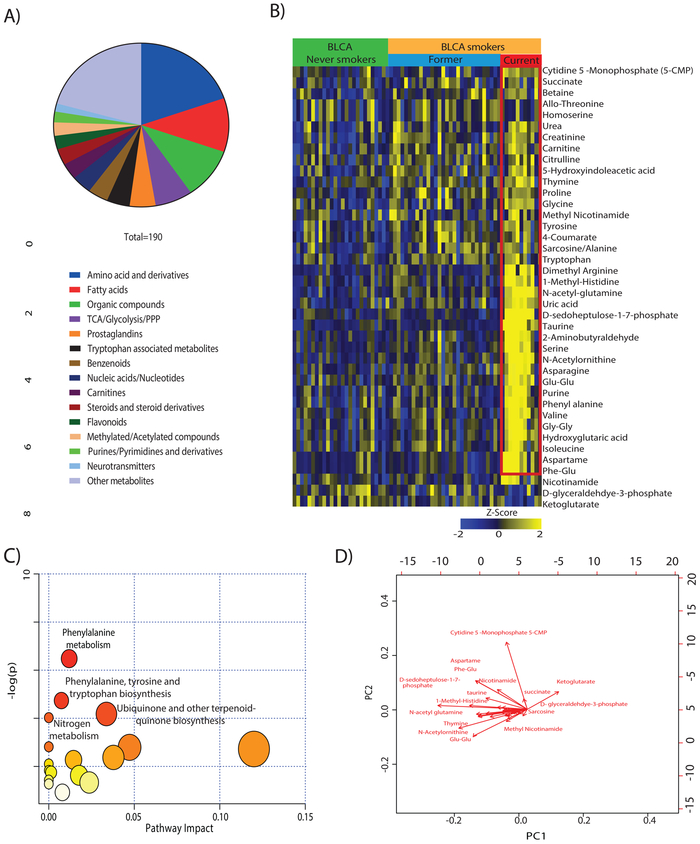
Figure 2. Metabolic profiling of BLCA Serum from smokers and non-smokers and identification of key altered pathways.
(A) Pie chart illustrating the different classes of metabolites obtained in global targeted metabolic profiling of serum samples from BLCA patients. A distinct color denotes each group of metabolites, and the arc length of each slice represents the percentage of that group in the obtained profile. (B) Heat map visualization of 40 significantly altered metabolites in BLCA smokers compared to never smokers (FDR=<0.25). Shades of yellow and blue represent upregulation and downregulation of metabolites respectively, relative to median metabolic levels. (C) Topology analysis of dysregulated metabolic pathways in association with BLCA smokers. The size of bubble area denotes the impact of each pathway, with a color representing the significance from highest in red to lowest in white. (D) Bi-plot showing the upregulated differential metabolites in BLCA smokers and never smokers.

