Figure 1.

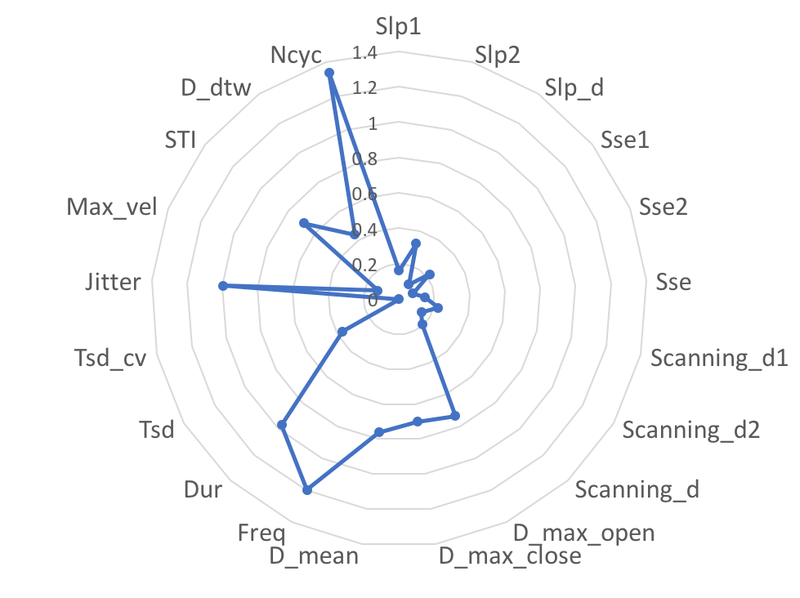
Spider chart that shows the effect sizes (Cohen’s D) of group differences between the participants with ALS and healthy controls based on 21 AMR variables.

Spider chart that shows the effect sizes (Cohen’s D) of group differences between the participants with ALS and healthy controls based on 21 AMR variables.