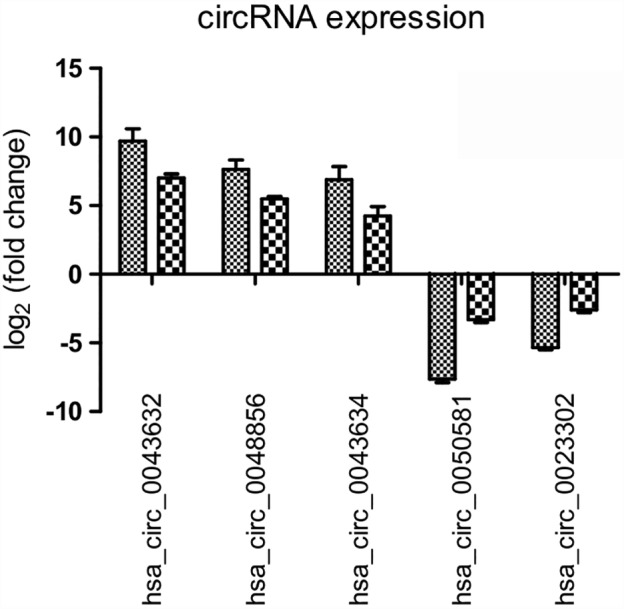
Figure 6.

Validation of microarray data by quantitative reverse transcriptase (RT)‐PCR. Five differentially expressed circular RNAs (circRNAs) were validated by qRT‐PCR. The heights of the columns in the chart represent the mean expression value of log2‐fold changes.  , Array;
  , PCR.
